- The latest weekly export sales and shipments update for soybeans shows the US on pace to export nearly 2.1 bb during 2022-2023, down 1% from last year's reported shipments.
- However, US available stocks-to-use continue to run tighter than last year, or any other year, based on the national average cash price.
- Futures spreads tell us the US supply and demand situation is not expected to loosen significantly any time soon, or possibly through the next marketing year.
The most recent US weekly export sales and shipments update was released Friday (January 20), for business the week ending Thursday, January 12. These updates usually come out on Thursday’s, meaning the data is at least a week old upon release, but was once again delayed due to the US holiday this past Monday (January 16). As USDA reports go, this set is actually useful as it gives us information on what actual export demand, as opposed to the countless folks wasting time making guesses on such things. This is actually one of the few sets of government data I actually pay attention be it daily, weekly, monthly, or quarterly.
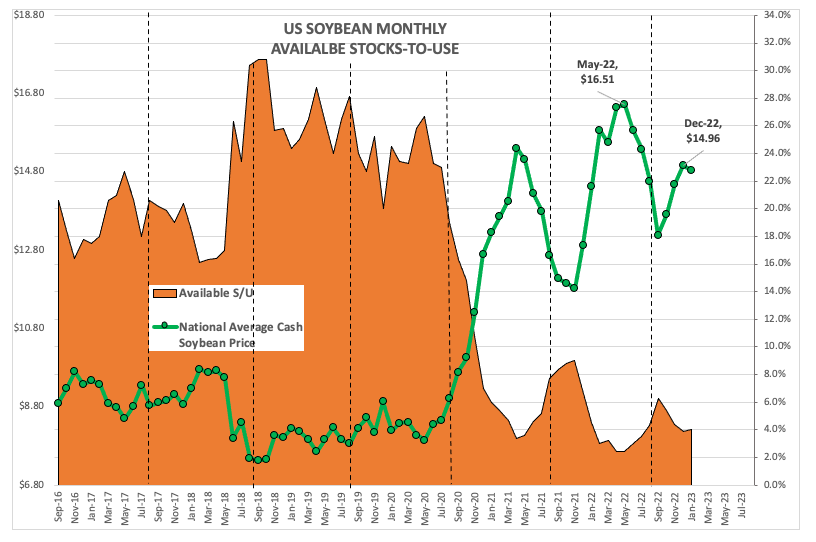
Last week I talked about US corn export demand, or the lack thereof due to tight available stocks-to-use, but what about soybeans (ZSH23)? As of Thursday evening (January 19) a soybean national average cash price index was calculated near $14.8475, correlating to an available stocks-to-use (as/u) figure of 4.0%. (Again, my numbers have nothing to do with USDA’s supply and demand guesses but instead are based on real supply and demand determining the market price. Or in other words, Economics 101.) This had loosened a bit from the end of December calculation of 3.9% when the cash index settled the month near $14.9575. However, last January saw the cash index finish at $14.4350 correlating to an as/u of 4.5%. The bottom line is the US as/u situation remains tighter than it was a year ago.
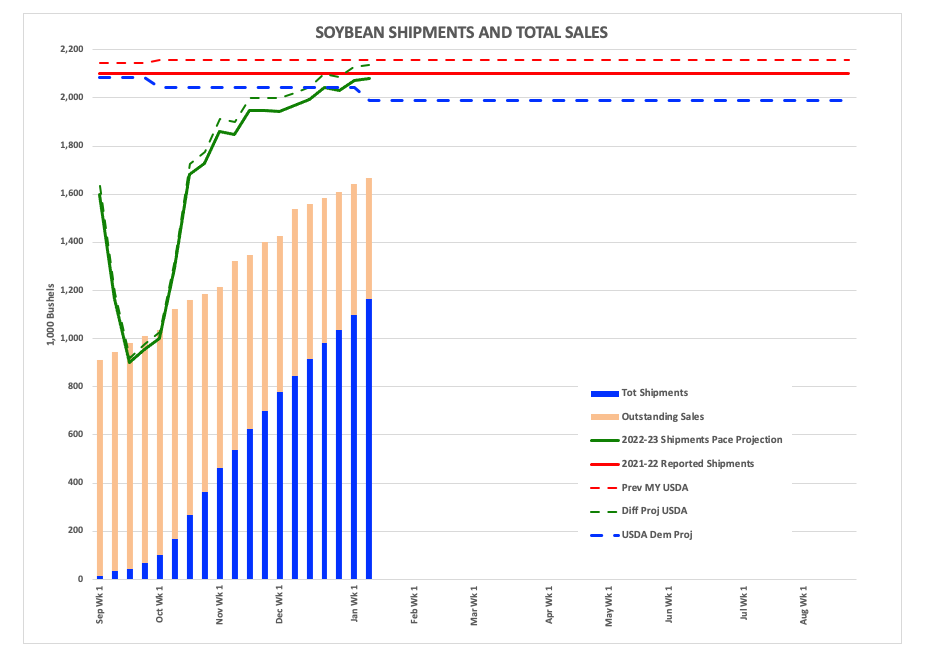
What did the latest weekly export sales and shipments update show us? The US had total sales (total shipments plus outstanding sales) of 1.668 billion bushels (bb), actually running 1% ahead of last marketing year for the same week. As for shipments, the US had reportedly moved 1.166 bb at a point in the marketing year when an average of 56% of what turns out to be total exports have been shipped. If we do some basic math, this projects total shipments for the 2022-2023 marketing year of 2.082 bb as compared to last year’s reported shipments of 2.101 bb. That’s a decrease of only 1%, at a time when US as/u is historically tight going back through at least January 2002.
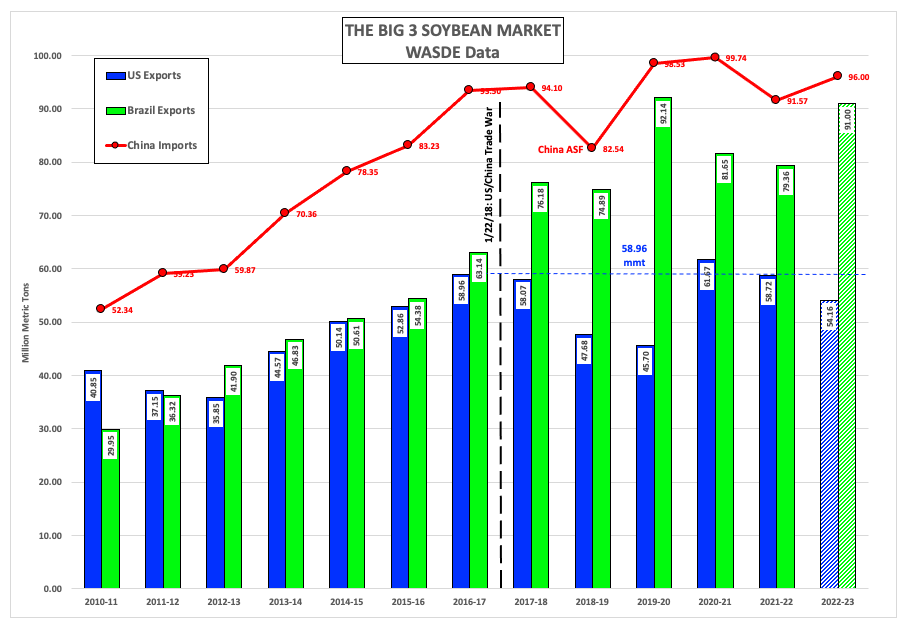
We also know the US has become a secondary supplier to the world’s largest buyer, China, with the trade relationship damaged with the onset of the US-China trade war 5 years ago this coming weekend. Since then, US exports of soybean have fallen from a reported 7% below Brazil to an estimated 50% gap during the 2019-2020 marketing year. The US has cut into the difference the last couple years, due in large part to weather reduced production in Brazil. However, Mother Nature has seemingly been kind to the South American soybean giant this year, pushing the difference back out to 40%.
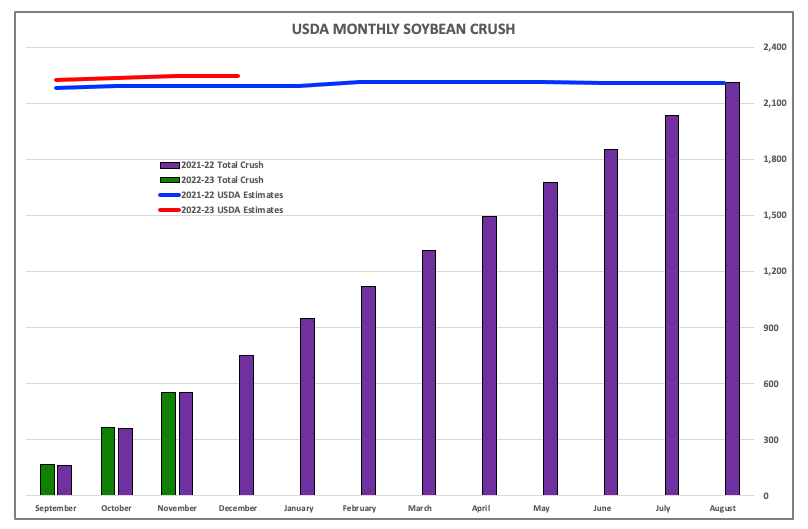
Here's the thing, though: It may not be all that bearish if the US starts to see a slowdown in its exports. Argentina’s crop has been hurt by adverse weather this year, and the US is expected to pick up some of the slack from the world’s largest soybean meal exporter. This means we could see US crush pick up its pace over the second half of the 2022-2023 marketing year, just as US soybean shipments are replaced by newly harvested Brazilian supplies.

The bottom line is our real fundamental reads; cash price (ZSPAUS.CM), basis, and futures spreads all remain bullish. More so than last year at this time. The most telling factor to me is futures spreads with the March-May closing Thursday at an inverse of 3.25 cents while the May-July finished at an inverse of 7.75 cents. At the end of January 2022, the 2022 editions of those same spreads closed at a carry of 4.75 cents and an inverse of 2.75 cents respectively. This speaks volumes about the commercial side of the market’s long-term concern over US supply and demand given those two spreads cover the timeframe for Brazil’s harvest to come in and move to port.
Finally, US as/u situation might not loosen a great deal next year either if corn planted area grows in comparison to soybeans. It is possible both could increase, though, but new-crop futures spreads are again inverted or at worst showing a weak carry (Nov23-Jan24). The bottom line is it will be hard to break the US market significantly until the fundamental picture starts to change. As Newsom’s Market Rule #6 tells us: Fundamentals win in the end.
More Grain News from Barchart
- Wheats Trading Red After Morning Trade
- Friday’s Soy Trade Mostly Higher
- Morning Corn Market Red Thus Far
- Mostly Red Close for Thursday Wheat
On the date of publication, Darin Newsom did not have (either directly or indirectly) positions in any of the securities mentioned in this article. All information and data in this article is solely for informational purposes. For more information please view the Barchart Disclosure Policy here.
/Micron%20Technology%20Inc_%20logo%20on%20building-by%20vzphotos%20vis%20iStock.jpg)

/Semiconductor%20chip%20by%20Mykola%20Pokhodzhay%20via%20iStock.jpg)

/Lululemon%20Athletica%20inc_%20storefront%20by-%20Robert%20Way%20via%20iStock.jpg)