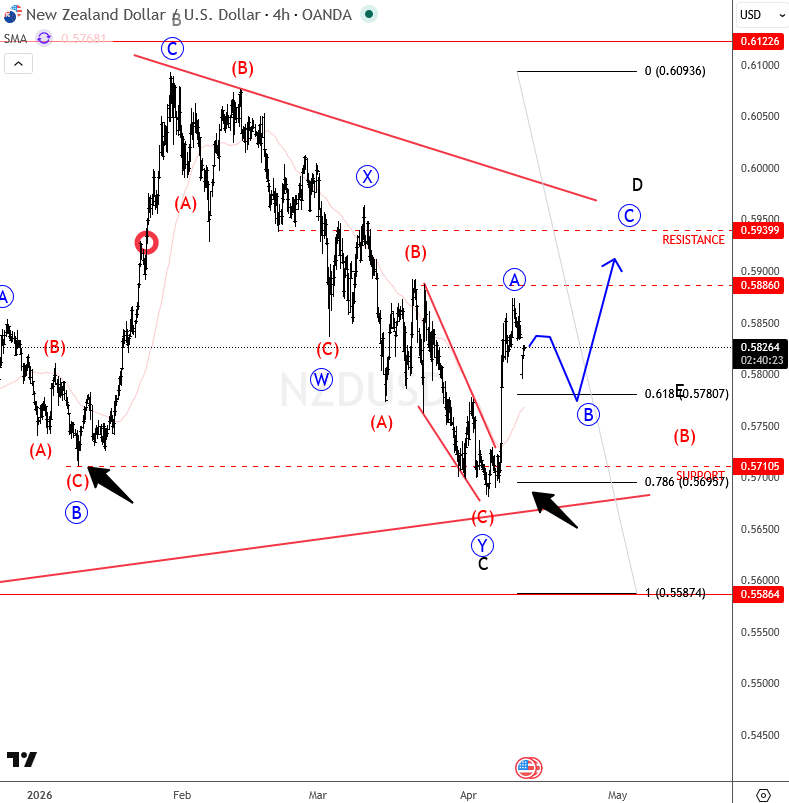
NZDUSD did not reach the 2025 highs, and the price has already turned back toward the 0.5850 area. The overlap in this region suggests that the entire price action since 2025 is still corrective. It may be forming a bullish ABCDE triangle, which is now our primary wave count. This range may not break easily or anytime soon. We could see the price move lower, but in a slow, overlapping wave structure, indicating a deep and complex WXY corrective decline within wave C.
We are actually tracking the wedge pattern within final subwave (C) of Y that caused a nice bounce in the last few sessions, and suggests that new temporary recovery is here and that more gains can be expected with A-B-C structure, towards the upper side of a triangle range.
We will cover all markets in todays scheduled webinar – tune in

/Quantum%20Computing/A%20concept%20image%20showing%20a%20ray%20of%20light%20passing%20through%20cyberspace_%20Image%20by%20metamorworks%20via%20Shutterstock_.jpg)
/International%20Business%20Machines%20Corp_%20logo%20on%20storage%20rack-by%20Nick%20N%20A%20via%20Shutterstock.jpg)

/Super%20Micro%20Computer%20Inc%20HQ%20photo-by%20Tada%20Images%20via%20Shutterstock.jpg)