

Description and Specifications
Crude oil is petroleum that is acquired directly from the ground. Crude oil was formed millions of years ago from the remains of tiny aquatic plants and animals that lived in ancient seas.
During the 19th century in America, an oil find was often met with dismay. Pioneers dug wells to find water or brine and were disappointed when they struck oil. In 1854, with the invention of the kerosene lamp, the first large-scale demand for petroleum emerged. Crude oil was the world's first trillion-dollar industry and accounts for the single most significant product in world trade. Crude oil is a relatively abundant commodity. The world has produced approximately 650 billion barrels of oil, but another trillion barrels of proven reserves have yet to be extracted.
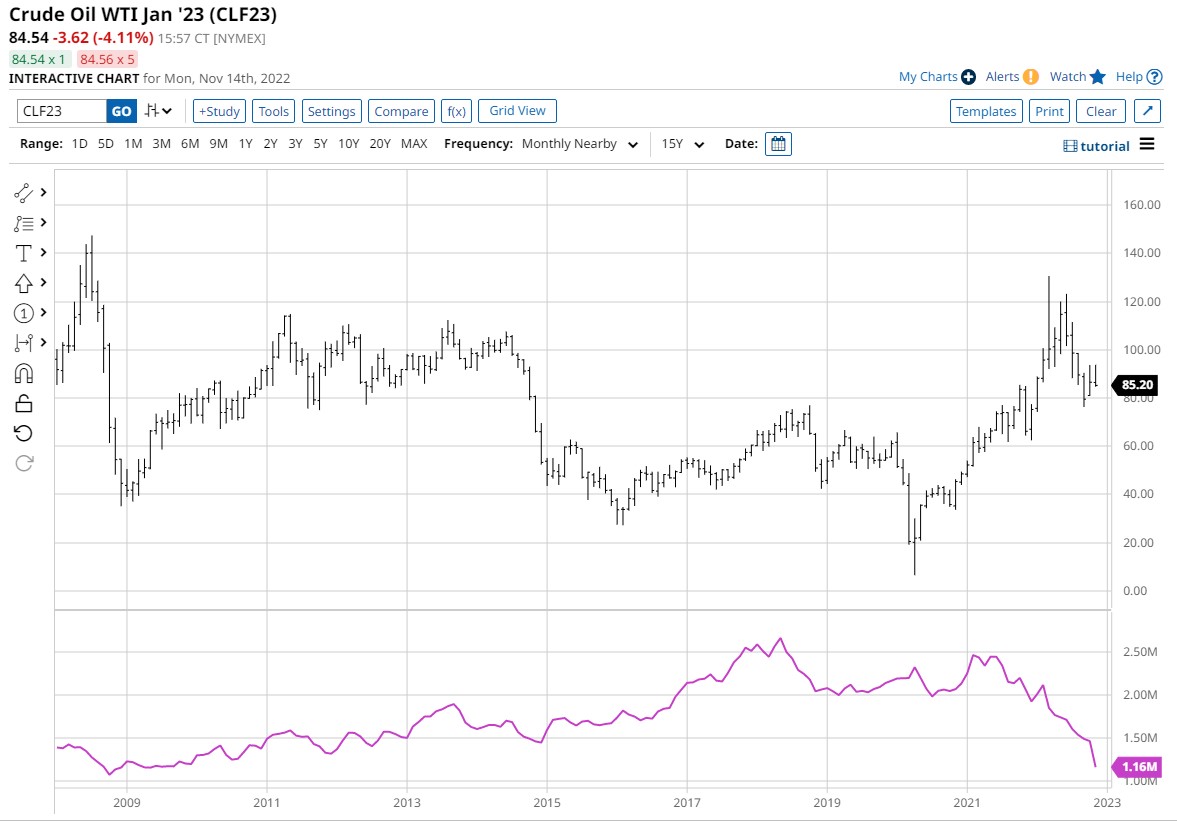
The above monthly nearby chart illustrates the cumulative open interest (number of contracts that have not been offset) in the crude oil market. Before 2019 the cumulative open interest was approximately 2.75m open positions. Today there are 1.16m open positions.
Open interest increases when a new buyer and a new seller make a contract increasing the number of open positions by one. During this time, the liquidity of the market is expanding.
Open interest decreases when both the buyer and seller of the contract are closing existing positions. During this time, the liquidity of the market is declining.
Currently, crude oil open interest is at a 13-year low. But why?
The most prominent futures market participants are commercial and non-commercial traders (managed money and other reportable traders). Commercial traders do approximately 60% of the daily volume, making them the big fish in the sea, followed by managed money.
Decreasing open interest reduces liquidity which leads to excessive volatility. When open interest declines, it's likely due to a reduction in commercial traders' (producers) hedging activity and managed money trend following activity in a bull market. Before the significant drop in open interest, the average daily range was approximately $1.50 per day. With two exceptions, one in March 2020, when crude oil went negative, the average daily range went to $12.50 per day. The other was the peak oil price in March 2020, reaching $9.5 daily. Recently we have averaged about $3.50 per day.
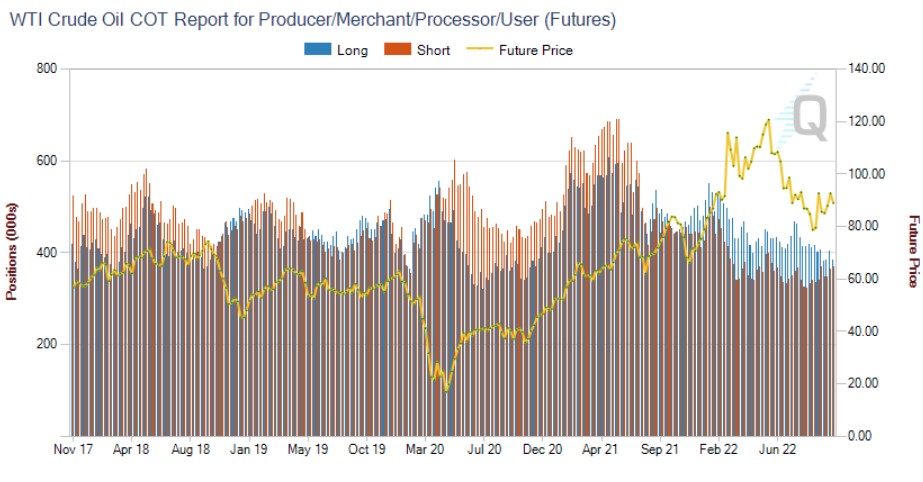
Graph 1 Source: CMEGroup
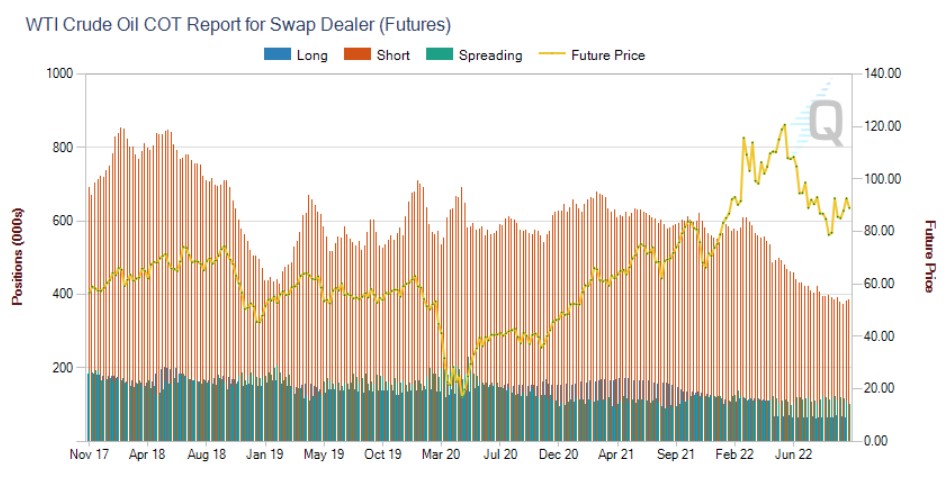
Graph 2 Source: CMEGroup
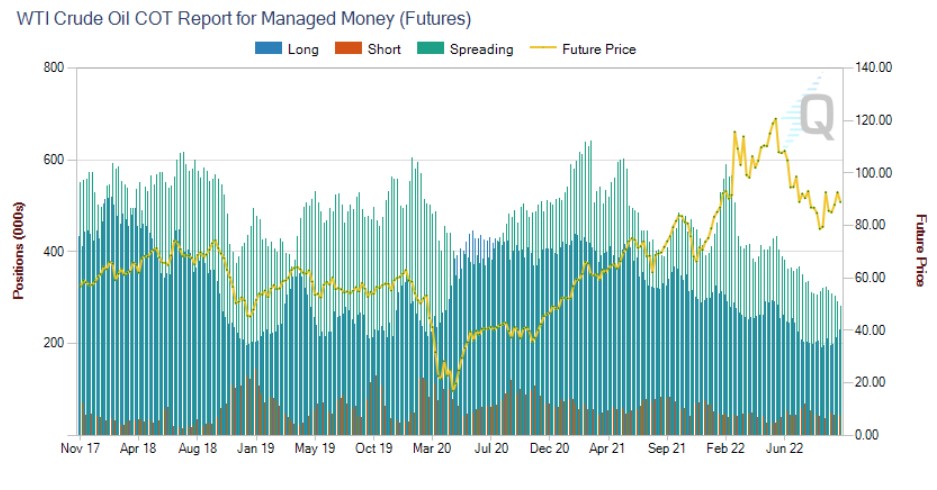
Graph 3 Source: CMEGroup
The above graphs illustrate each group's gross positions (scale on the left). The scale on the right is the market price.
Since April 2021, Producers, Swap Dealers, and Managed Money traders have significantly reduced their market positions.
Graph 1 shows that the producer's short positions are less than the processor's long positions giving the commercials a net long position. Typically this category is net short because the producers trade significant short positions. Producers have reduced or stopped their hedging when commercials are net long. Crude oil has been in backwardation (front-month prices are higher than back-month prices) for more than a year, making it difficult for producers to hedge production.
Graph 2 shows those swap dealers who are also hedging, but they are institutional firms hedging for commercial clients who need off-exchange non-standardized contracts made.
Graph 3 managed money traders are typically trend followers. Their uptrends push prices to the producers to allow them to sell. Their downtrends drive prices to the processors to enable them to buy. If the commercial producers are not (selling) hedging, the managed money does not have the liquidity required to support their (uptrend) positions. Managed money traders have large positions and need a counterpart to provide that liquidity.
With a looming recession signaling an economic slowdown, managed money might not see a good return on long positions in the crude oil market, limiting their willingness to buy more contracts.
Interestingly the daily volume has been staying elevated. We know that the more prominent traders holding overnight positions have reduced them. This only means that day trading volume supports the crude oil average daily volume levels. Day trades are not calculated into open interest. Due to the short-term nature of day traders, this will lead to increased volatility.
Summary
With many large traders reducing their overnight position sizes, traders could consider shortening their duration of crude oil trading. Eventually, the backwardation will revert to a normal market (the front month is priced less than the back months), and the liquidity will return, allowing for longer-term trends.
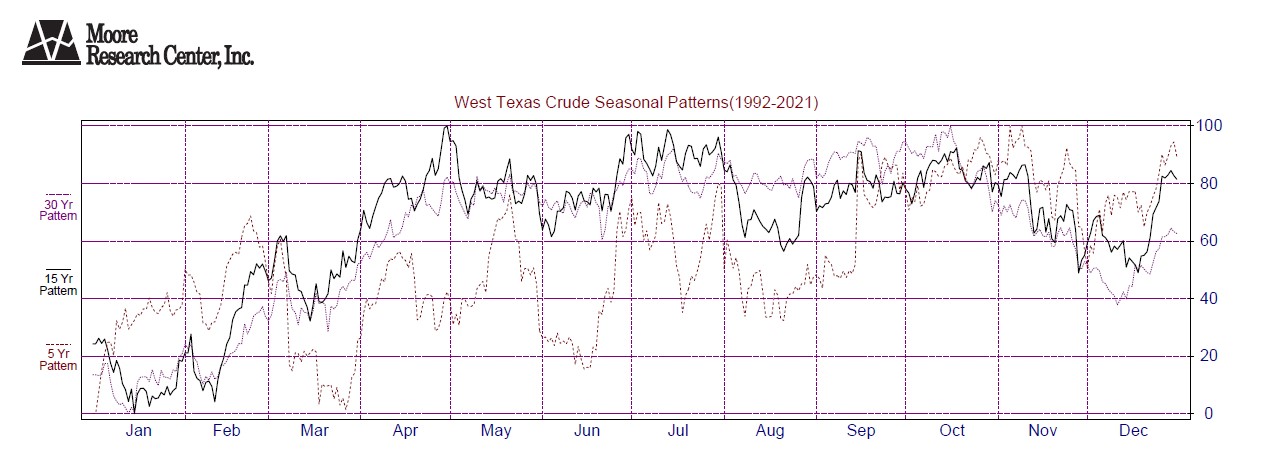
Source: Moore Research Center, Inc. (MRCI)
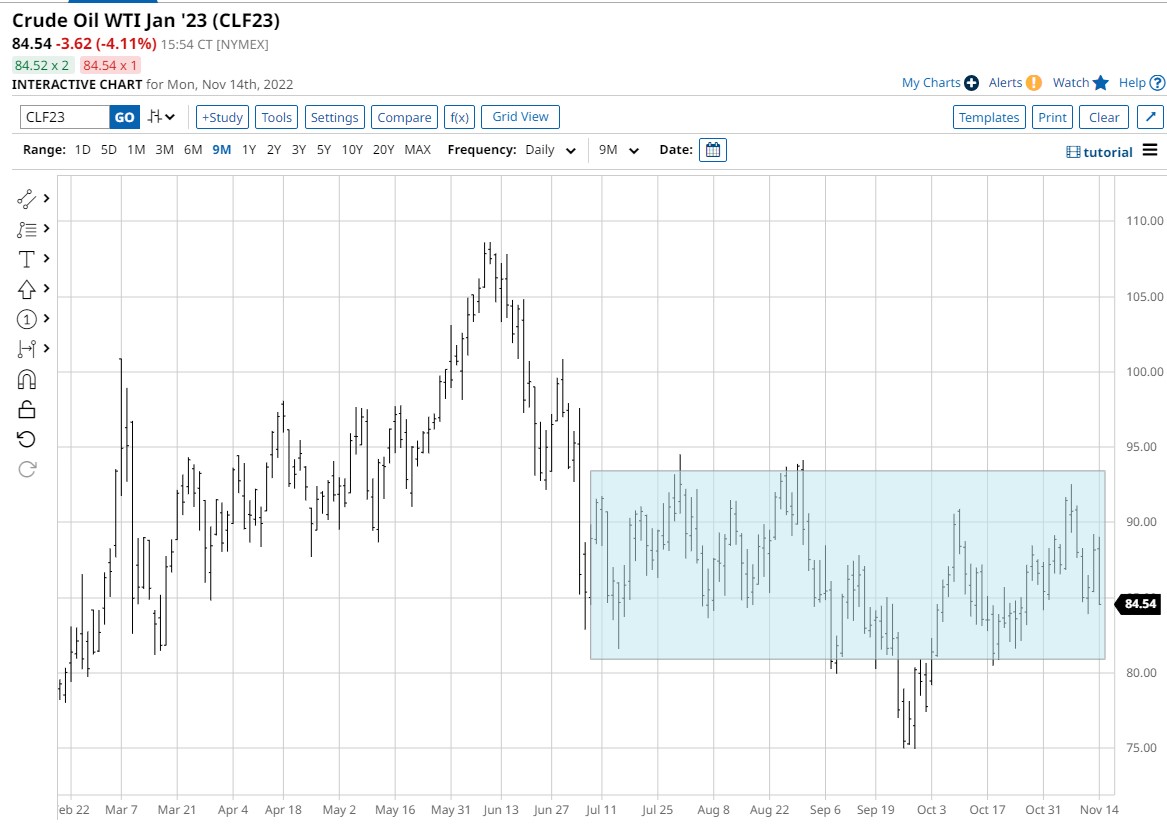
MRCI's 15 years of historical seasonal data research has found that crude oil prices have declined from October to mid-December. Currently, the market has been in a sideways channel since July. With the liquidity issue, the market may break the channel and begin a downward trend.
More Energy News from Barchart
- Nat-Gas Prices Gain on Below-Normal U.S. Temps
- Crude Sharply Lower on Chinese Energy Demand Concerns
- Crude Falls on Dollar Strength and Global Energy Demand Concerns
- Natural Gas- A Dangerous Winter Has Arrived
/Microsoft%20headquarters%20By%20Peter.jpeg)

/Amazon%20-%20Image%20by%20bluestork%20via%20Shutterstock.jpg)
/A%20close-up%20of%20the%20Broadcom%20logo%20on%20a%20smartphone%20by%20Timon%20via%20Adobe%20Stock.jpeg)