Calculating the silver-gold ratio involves dividing gold’s price by silver’s. Gold and silver have a long history as means of exchange or hard currency. Central banks hold gold as an integral part of foreign currency reserves. However, they abandoned holding silver because of the precious metal’s penchant for wide price variance.
When I was a child, my grandfather called the coins in his pocket silver. At that time, in the 1960s, dimes and quarters still had silver content. On July 23, 1965, President Lyndon Johnson approved the Coinage Act of 1965, removing silver from circulating coins and authorizing that clad coins to be used for half-dollar, quarter, and dime coins. A clad coin has multiple metal levels, including an inner core of pure copper, with outer layers of a nickel-copper alloy that resembles silver. Today, US coins remain clad coins made of nickel, copper, and zinc.
While we no longer have silver or gold coins jingling in our pockets, the precious metals remain the oldest means of exchange. Gold and silver have financial and industrial applications dating back thousands of years. The first Egyptian pharaoh, Menes, declared that two and one-half parts silver equal one part gold in 3200 BCE, the earliest recorded reading of the silver-gold ratio.
The ratio rose to a record high as the pandemic stuck
In March 2020, as the global pandemic weighed on markets across all asset classes, gold and silver prices declined. However, the more volatile silver futures market suffered a more significant percentage drop than gold, pushing the silver-gold ratio to the highest level in decades.
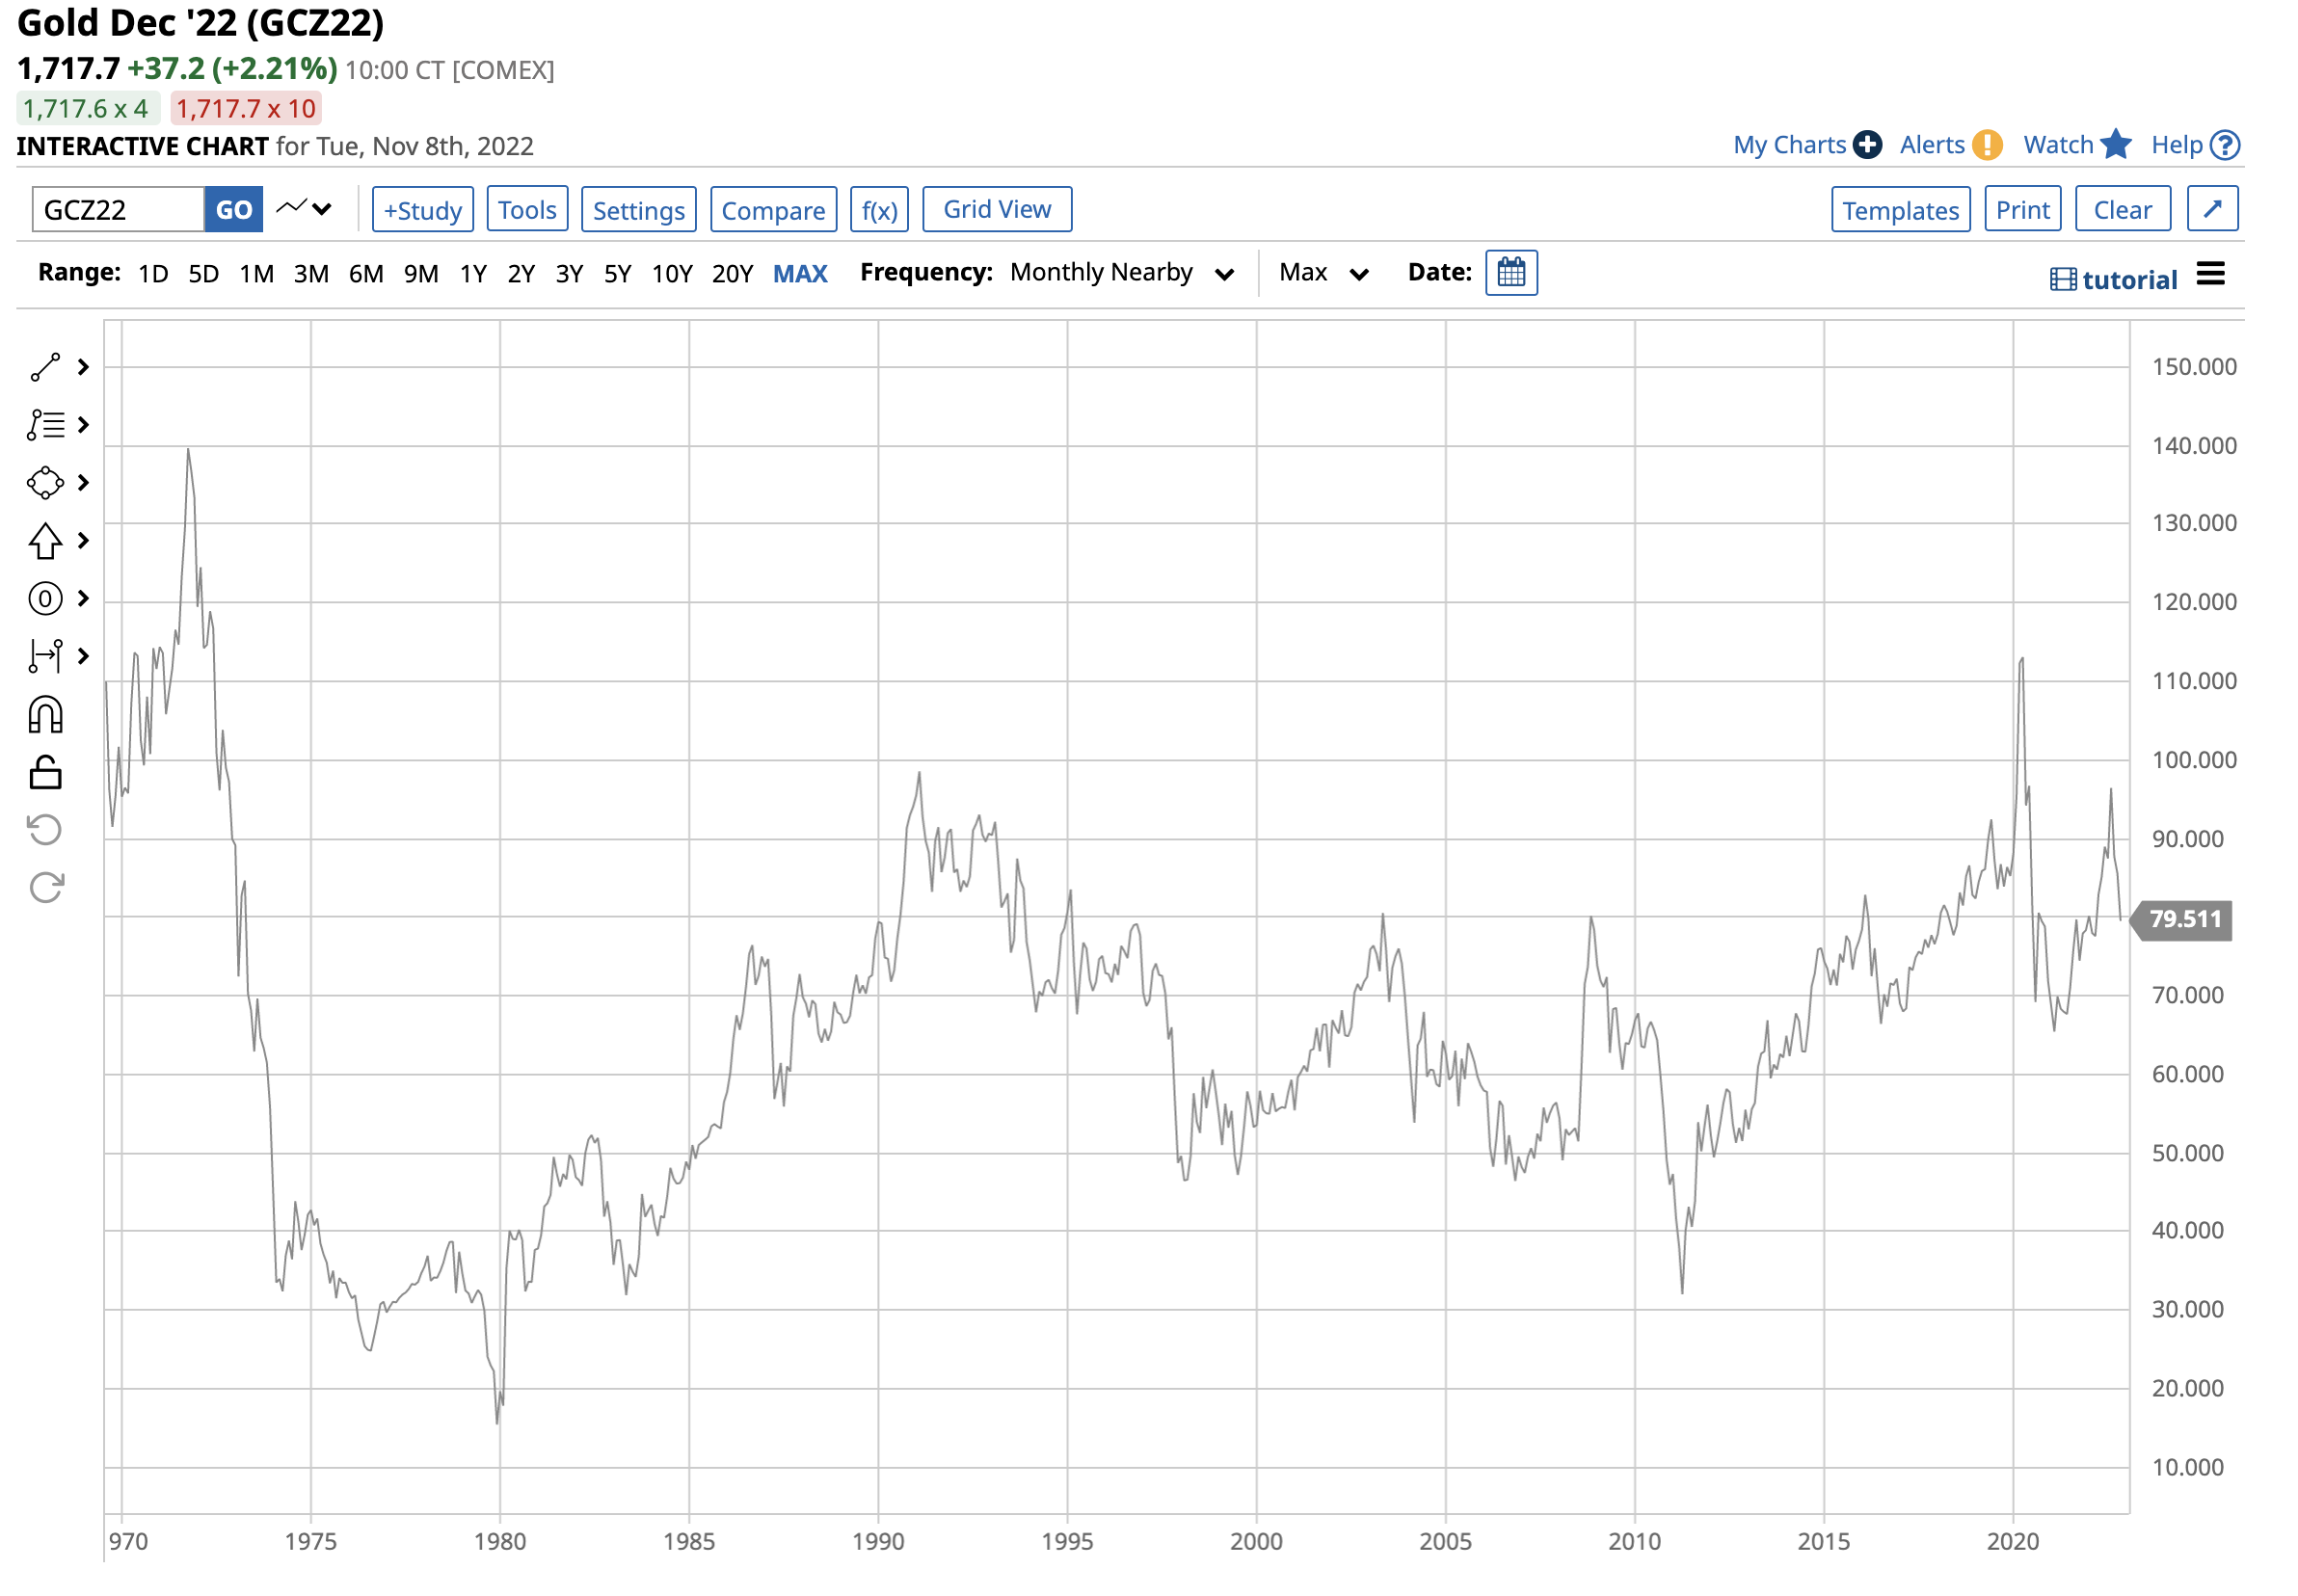
The chart ({GCZ22}/{SIZ22}) highlights the spike to over the 113:1 level, where an ounce of gold had the same value as 113 ounces of silver. Silver futures fell to the lowest price since 2009 of $11.735, while gold futures declined to $1,452.10, holding above the November 2019 $1,447.10 bottom. Silver’s penchant for extreme price variance caused the ratio to spike. Since then, the price relationship has made lower highs and lower lows.
The ratio reached a low when inflation began to move higher
Action in the silver market tends to drive the price to lows during price corrections and highs during rallies. In February 2021, silver rose to over $30 per ounce, nearly three times the March 2020 low, causing the ratio to plunge.
As inflation rose in early 2021, silver outperformed gold. The chart shows ({GCZ22}/{SIZ22}) the ratio fell to a low of around 65:1 in February 2021, the lowest level since 2014. After a recovery to the 96:1 level in September 2022, the ratio turned lower.
The ratio has declined since early September 2022
At just below the 80:1 level on November 8, the silver-gold ratio was at the midpoint of the February 2021 low and the September 2022 high. Over the past fifty years, the average for the ratio has been between the sixty and seventy to one level.
The silver-gold ratio is nothing more than a measure of silver’s value compared to gold, but it provides clues about the path of least resistance for the precious metals prices for at least two reasons. First, since silver is far more volatile, it reflects the speculative interest in the precious metals as investors and trend-following speculators tend to flock to silver when the precious metals are shining and moving higher. Second, since both metals have a financial and industrial component, rising silver prices is a sign of increased demand for the metals with unique properties. Since the early September high, silver has outperformed gold. On Tuesday, November 8, nearby COMEX December silver futures were around the $21.60 per ounce level, with December gold futures sitting at around $1,715 per ounce.
While the latest action in the ratio suggests that precious metals could move higher, they face bearish headwinds.
Precious metals face bearish factors
At last week’s FOMC meeting, the US central bank pushed the short-term Fed Funds Rate higher by 75 basis points for the fourth consecutive time. The short-term benchmark was at zero in March 2022 and now sits in a range from 3.75% to 4.00%. While the hawkish Fed has rapidly increased short-term rates, quantitative tightening pushes rates higher further out along the yield curve.
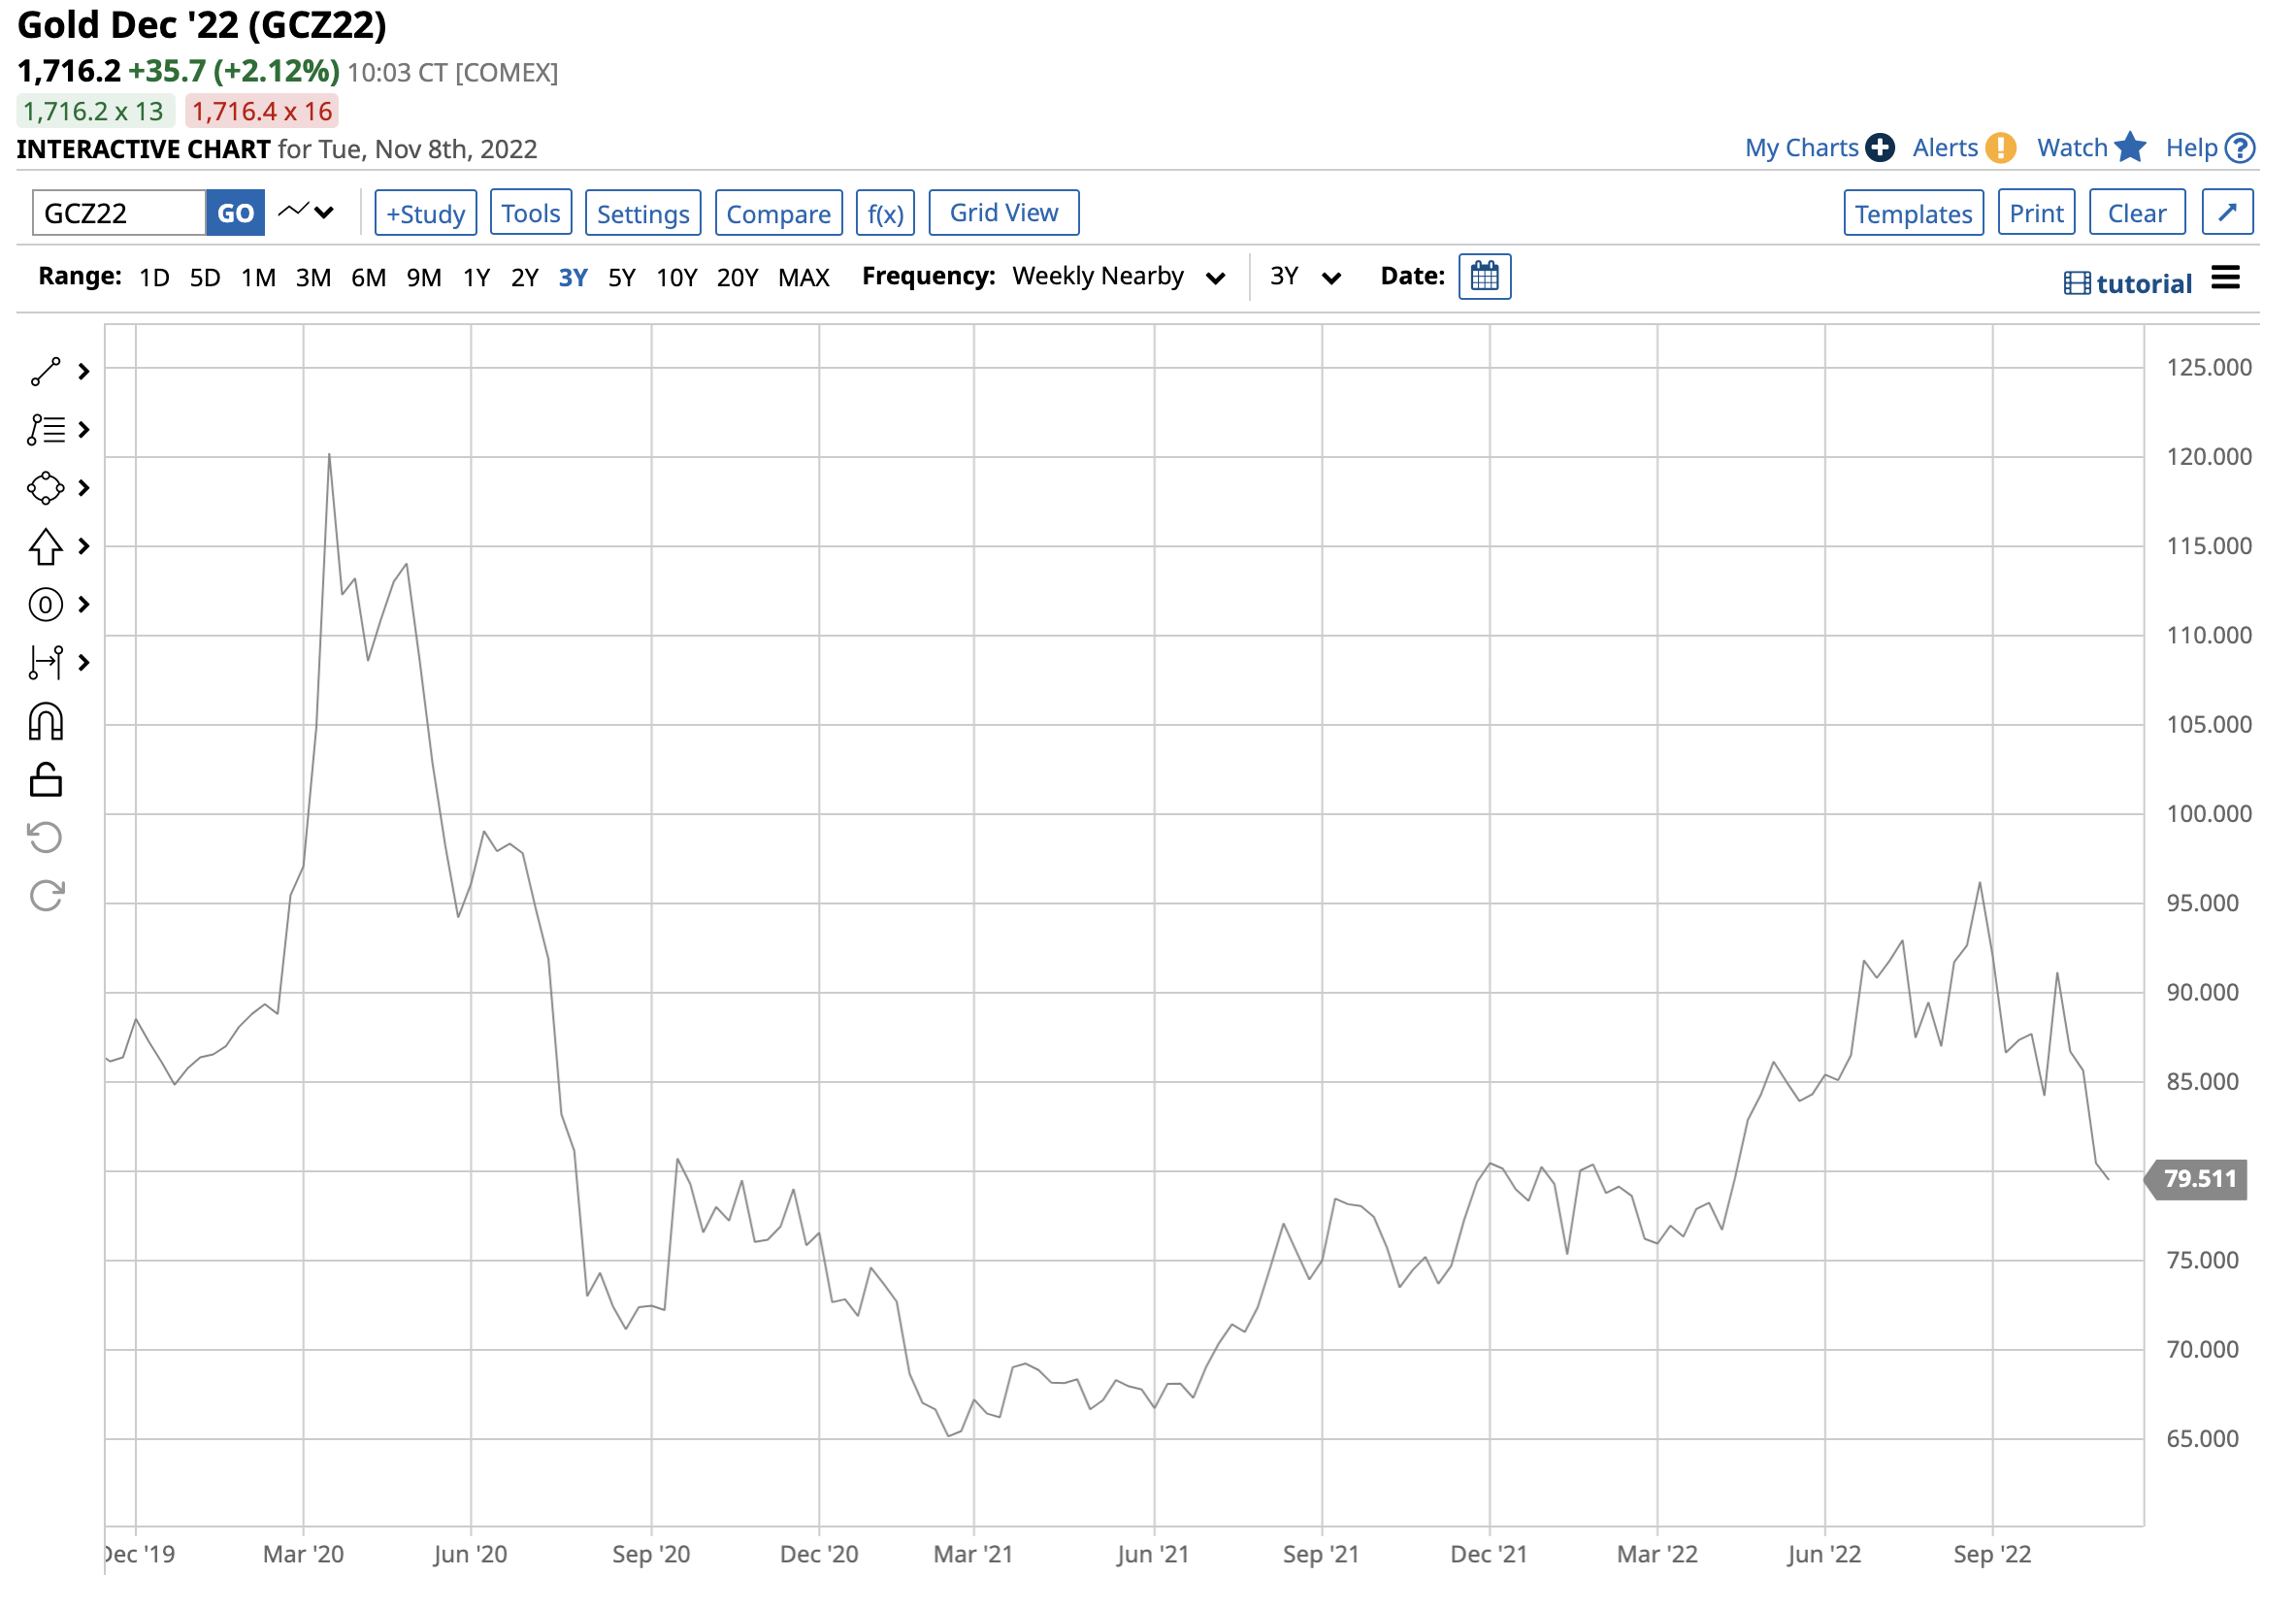
The chart of the US 30-Year Treasury bond futures contract shows at below the 120 level, the long bond futures are at the lowest level since 2011. As interest rates rise, fixed-income assets become more attractive than stocks and precious metals, attractive capital away from the latter. Moreover, higher rates increase the cost of holding precious metals, historically weighing on their prices.
Meanwhile, since interest rate differentials are a primary factor for the path of least resistance of currency values, the US dollar has exploded higher in 2022.
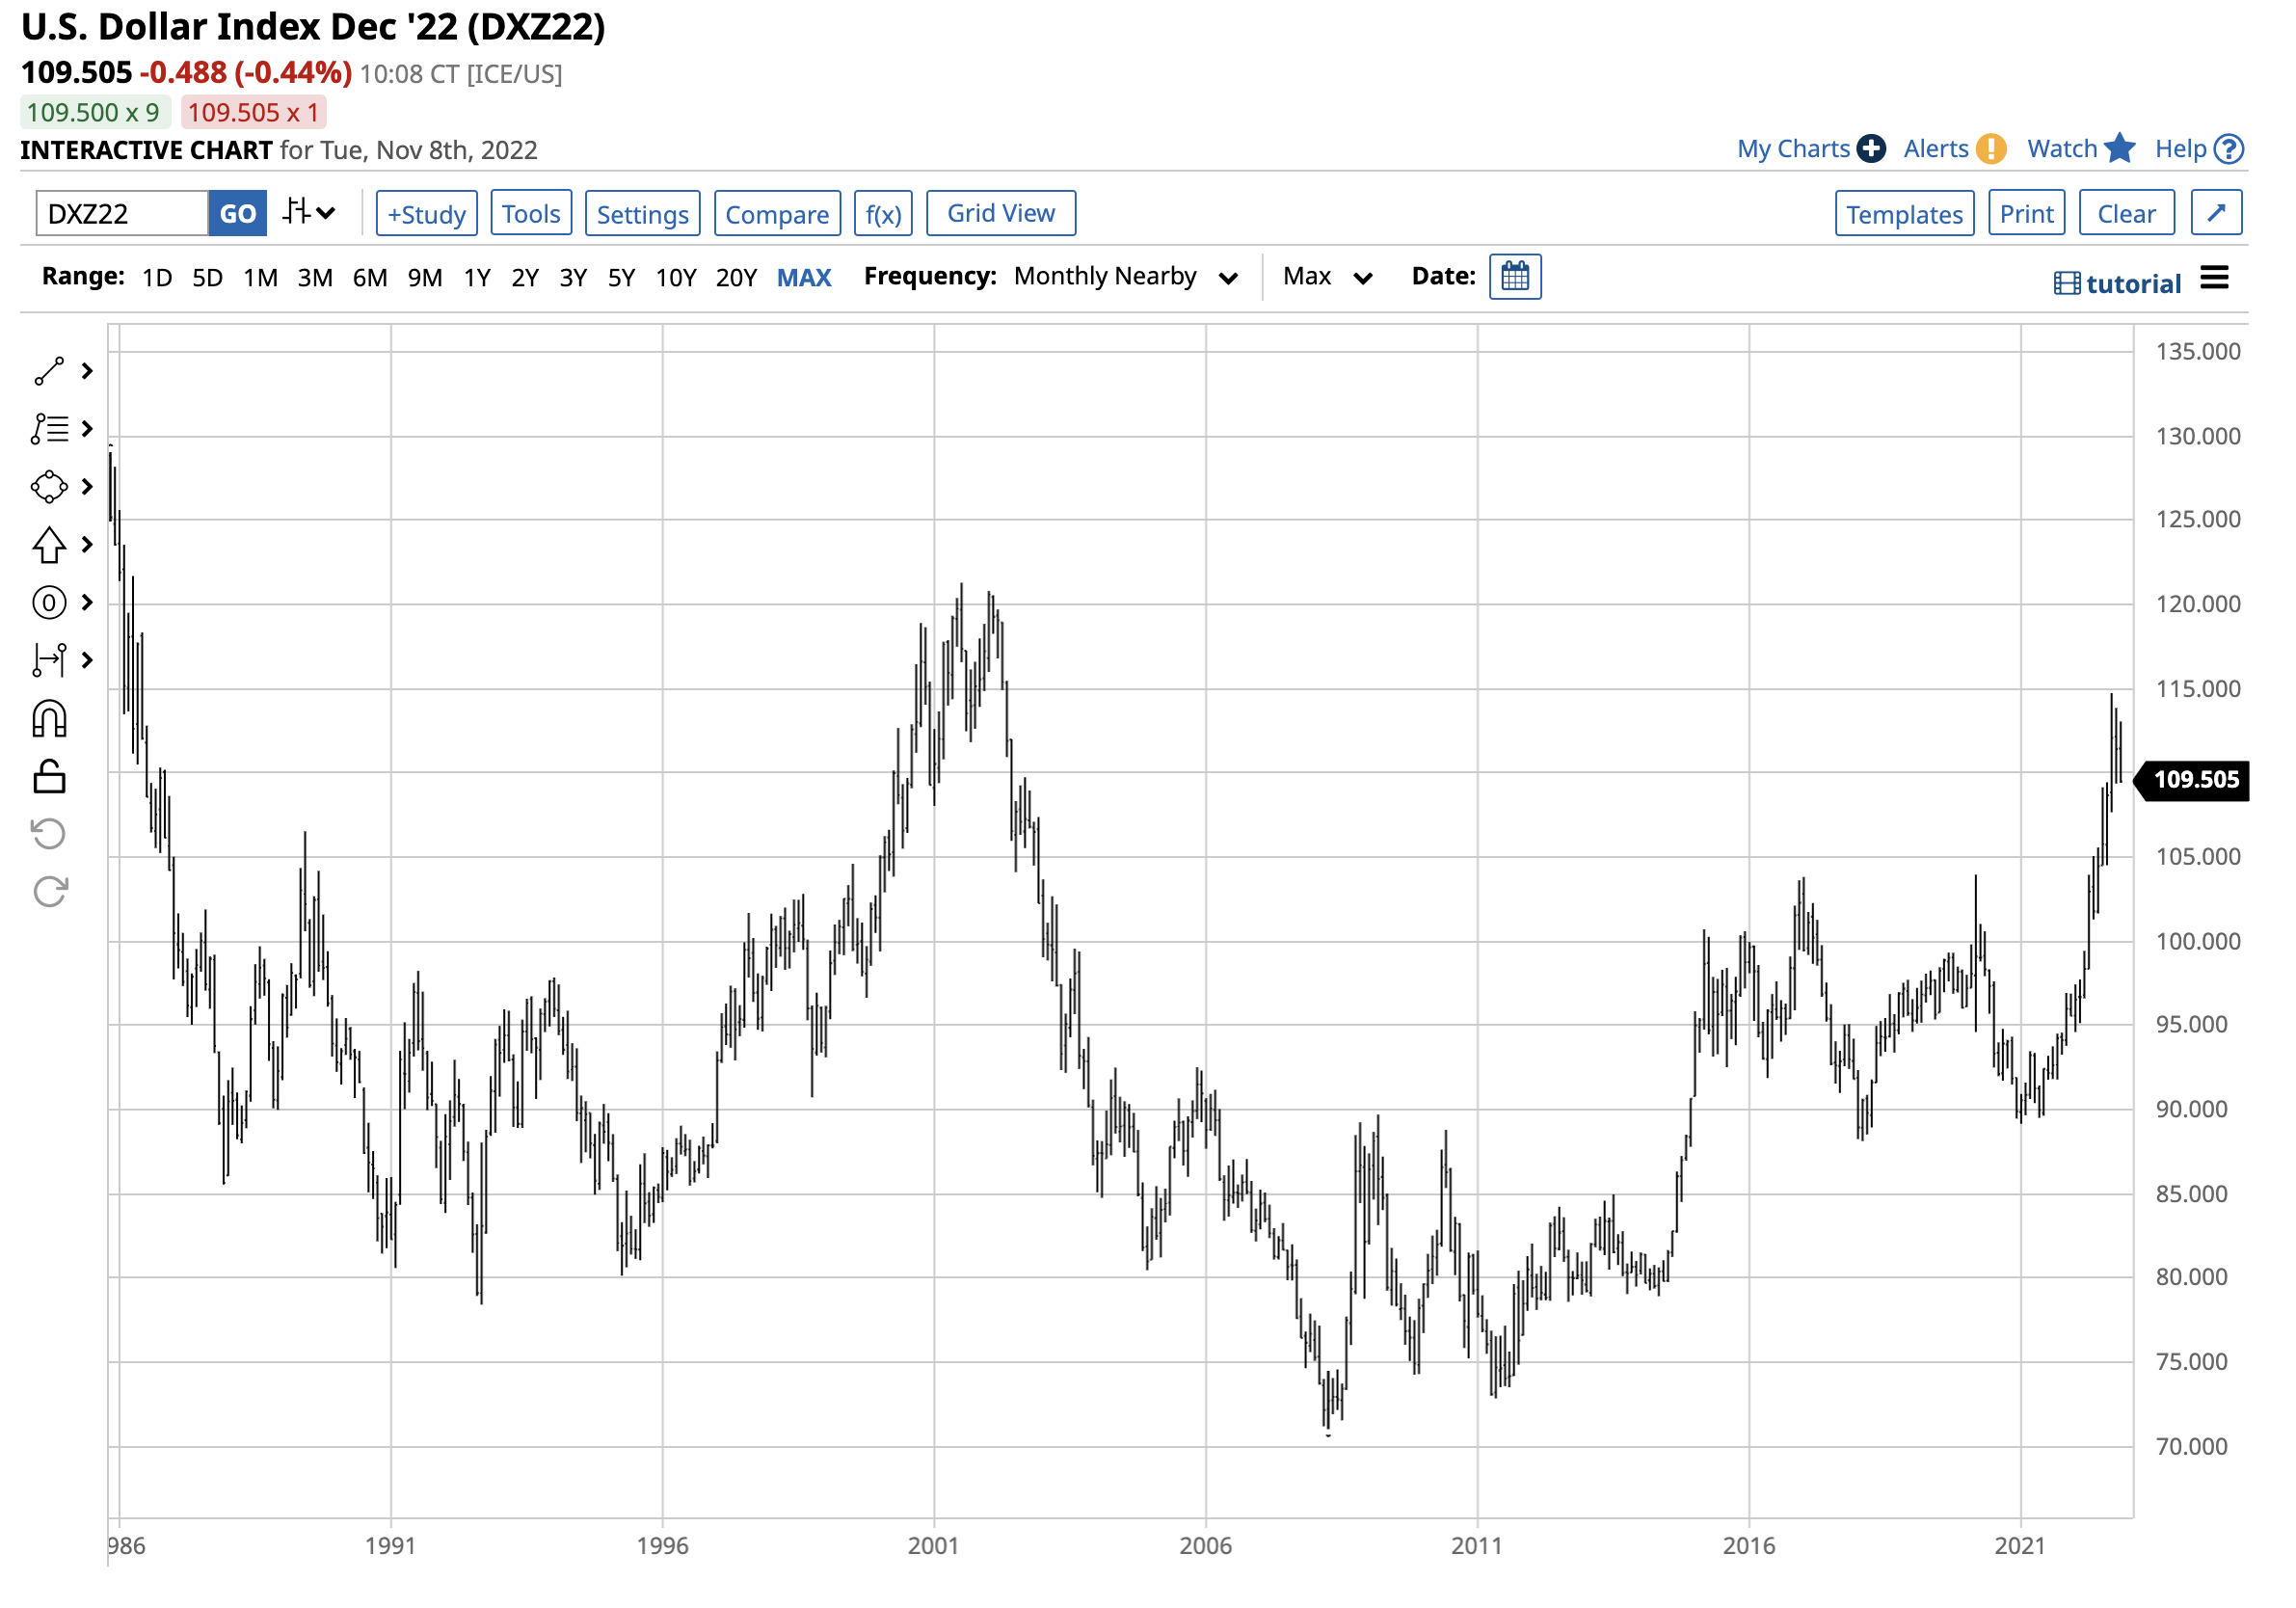
The chart of the dollar index futures contract highlights the rally to a two-decade high. Since the dollar is the world’s reserve currency, it is the benchmark currency for pricing precious metals. Gold and silver prices tend to move lower when the US dollar appreciates against other currencies and vice versa.
The ratio warns against becoming too bearish in the current environment
Interest rates and currency values typically support lower gold and silver prices, but 2022 is anything but an ordinary year. Inflation is at the highest level in four decades, and the first major European conflict since WW II continues to rage in Ukraine. The geopolitical bifurcation between the world’s nuclear powers has increased the risk of the conflict spreading beyond Ukraine’s borders. China has not been shy about its reunification plans with Taiwan in Asia, and North Korea has intensified its missile tests. With China, Russia, and their allies on one side and the US, Europe, Japan, and theirs on the other, the global landscape has become dangerous. The bifurcation threatens the dollar’s status as the world’s reserve currency. Russia recently declared that 5,000 rubles are exchangeable for one gram of gold. If China follows Russia’s lead, it could boost gold to a new level as a means of exchange in the worldwide financial system.
The silver-gold ratio is sitting at the short-term midpoint at the 80:1 level, but it remains above the long-term average level at 60-70 ounces of silver value in each ounce of gold value. A rising ratio tends to signal lower gold and silver prices, while a decline in the metric has been historically bullish. Keep an eye on the ratio for clues as gold and silver face conflicting pressures from interest rates and the US dollar on the bearish side and the geopolitical landscape on the other. The recent move in the ratio warns us not to be too bearish in the current environment.
More Metals News from Barchart
- Stocks Climb as T-Note Yields Fall
- Dollar Slips on Strength in Euro and a Rally in Stocks
- Dollar Falls Sharply as Fed Officials Allow for Smaller Rate Hikes
- Stocks Climb on China Optimism and Strength in Chip Stocks
/NVIDIA%20Corp%20logo%20outside%20building-by%20BING-JHEN_HONG%20via%20iStock.jpg)
/Microsoft%20headquarters%20By%20Peter.jpeg)
/Micron%20Technology%20Inc_%20logo%20on%20building-by%20vzphotos%20vis%20iStock.jpg)
/Amazon%20-%20Image%20by%20bluestork%20via%20Shutterstock.jpg)