Corn Dec '13 (ZCZ13)
[[ item.lastPrice ]] [[ item.priceChange ]] ([[ item.percentChange ]]) [[ item.tradeTime ]] [CBOT]
[[ item.bidPrice ]] x [[ item.bidSize ]] [[ item.askPrice ]] x [[ item.askSize ]]
for [[ item.sessionDateDisplayLong ]]
Find the latest Corn prices and Corn futures quotes for all active contracts below.
[[ timeframe ]] futures price quotes as of Fri, Jul 17th, 2026.
Latest price quotes as of [[ snapshotDate ]].
[[ timeframe ]] futures price quotes, based on [[ timeframe ]] data.
Looking for expired contracts? Check out our Corn Historical Prices page.

Corn Turning Higher at Midday
Corn futures are trading with contracts 2 to 3 cents across most contracts on Friday, with bulls fighting off early weakness. The CmdtyView national average...

Wheat Rallying Through Friday’s Midday
The wheat complex is reverting from Thursday weaker trade to post midday gains across the complex. Chicago SRW contracts are up 6 to 7 cents in most contracts....
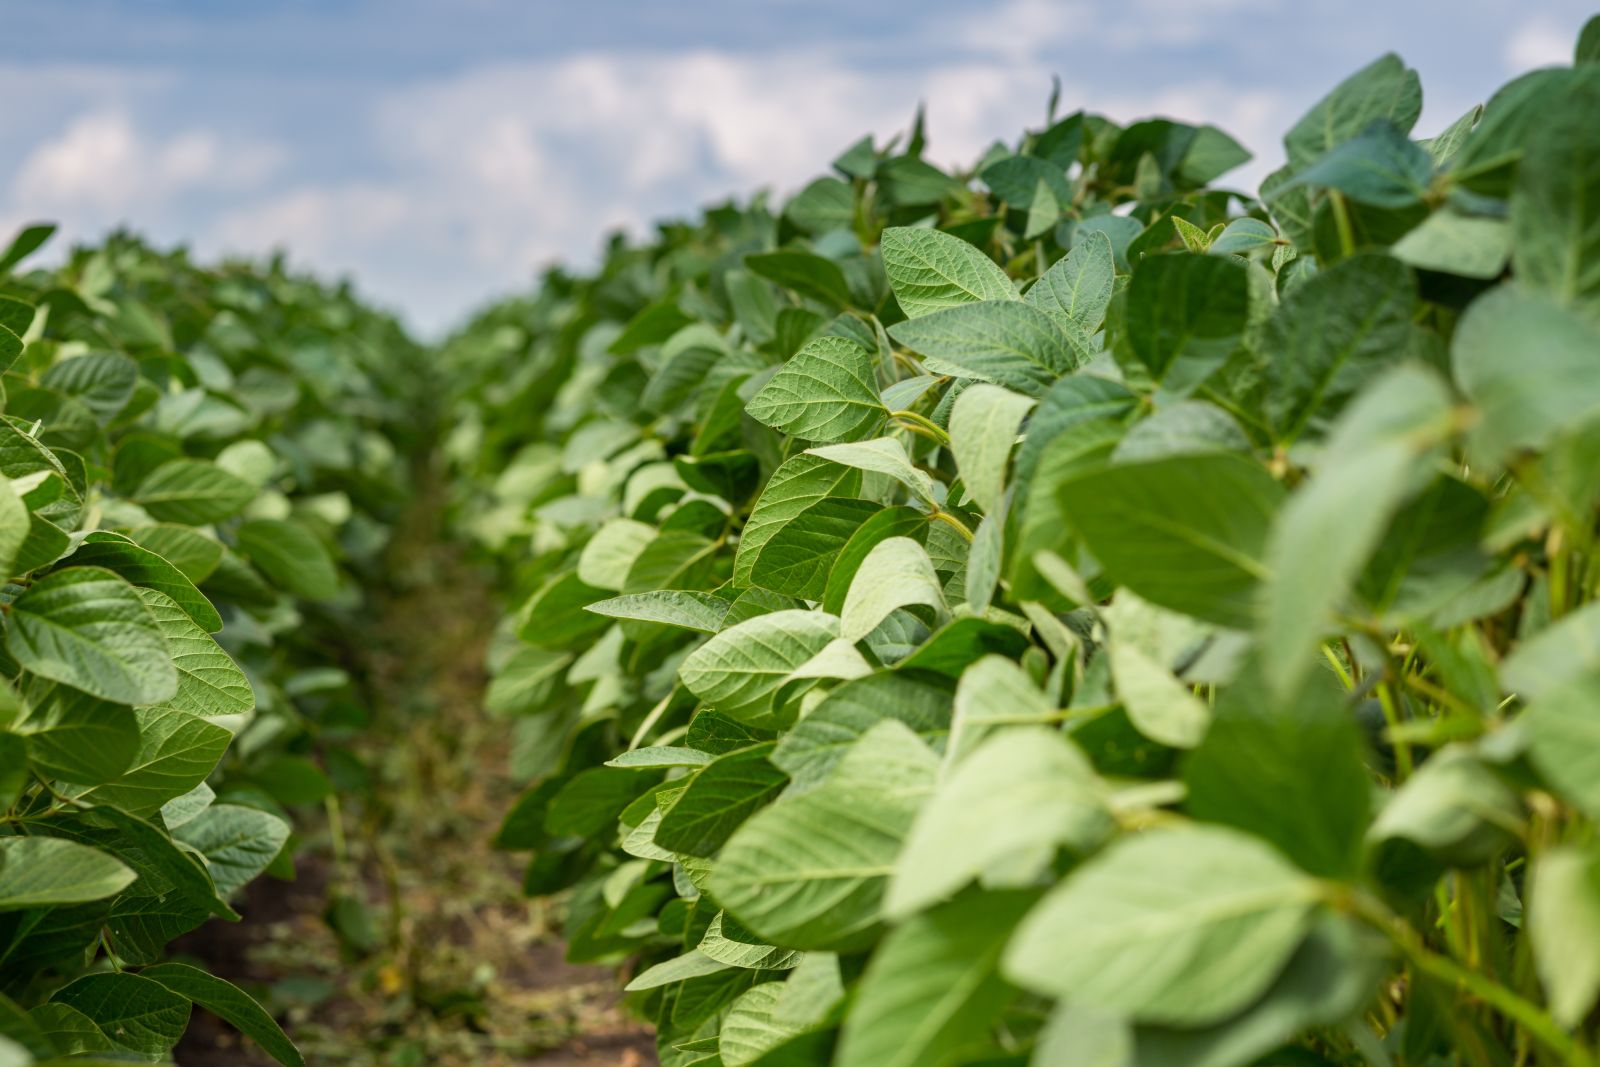
Soybeans Holding onto Midday Gains, Following Slew of Export Business
Soybeans are rebounding from the Thursday weakness with contracts up 6 to 8 cents in most contracts at midday. The cmdtyView national average Cash Bean...

Petri Dish: Why AI Will Replace the Farmer
The Amazon Prime program Clarkson's Farm has given us a glimpse of the future of agriculture and farmers.

Wheat Bulls Starting Friday Morning with Gains
Wheat is trading 3 to 8 cent gains across the three markets on Friday. The wheat complex slipped back on Thursday, with contracts marginally lower. Chicago...

Soybeans Posting Modest Friday AM Strength
Soybeans are showing 2 to 3 cent action so far on Friday. Futures were weaker on Thursday, with contracts down 6 to 7 ¼ cents on the day. Preliminary...

Wall Street Just Punished Netflix’s Guidance, But the Real Story Could Send the Stock Much Higher
Netflix's earnings were solid, but weaker guidance sent the stock lower. For long-term investors, the selloff may offer an attractive opportunity to buy...

After This Stock Popped on Earnings, Options Traders Are Betting $6.8 Million on a Short Call Diagonal Spread
First Horizon gained 1.84% on strong Q2 earnings, driving options volume 17 times its 30-day average. One unusually active call option from Thursday trading...

Why Circle Stock Is the Most Divisive Name in Fintech Right Now
Circle Internet Group downgraded by Mizuho analyst flagging threats to its open USD model.
/A%20concept%20image%20of%20space_%20Image%20by%20Canities%20via%20Shutterstock_.jpg)
Why Piper Sandler Likes AST SpaceMobile (ASTS) Stock Over Other Space Stocks
Piper Sandler issued a bullish note in favor of AST SpaceMobile stock. Here’s why analyst Alexander Potter recommends buying ASTS shares.
Corn Turning Higher at Midday
Corn futures are trading with contracts 2 to 3 cents across most contracts on Friday, with bulls fighting off early weakness. The CmdtyView national average...
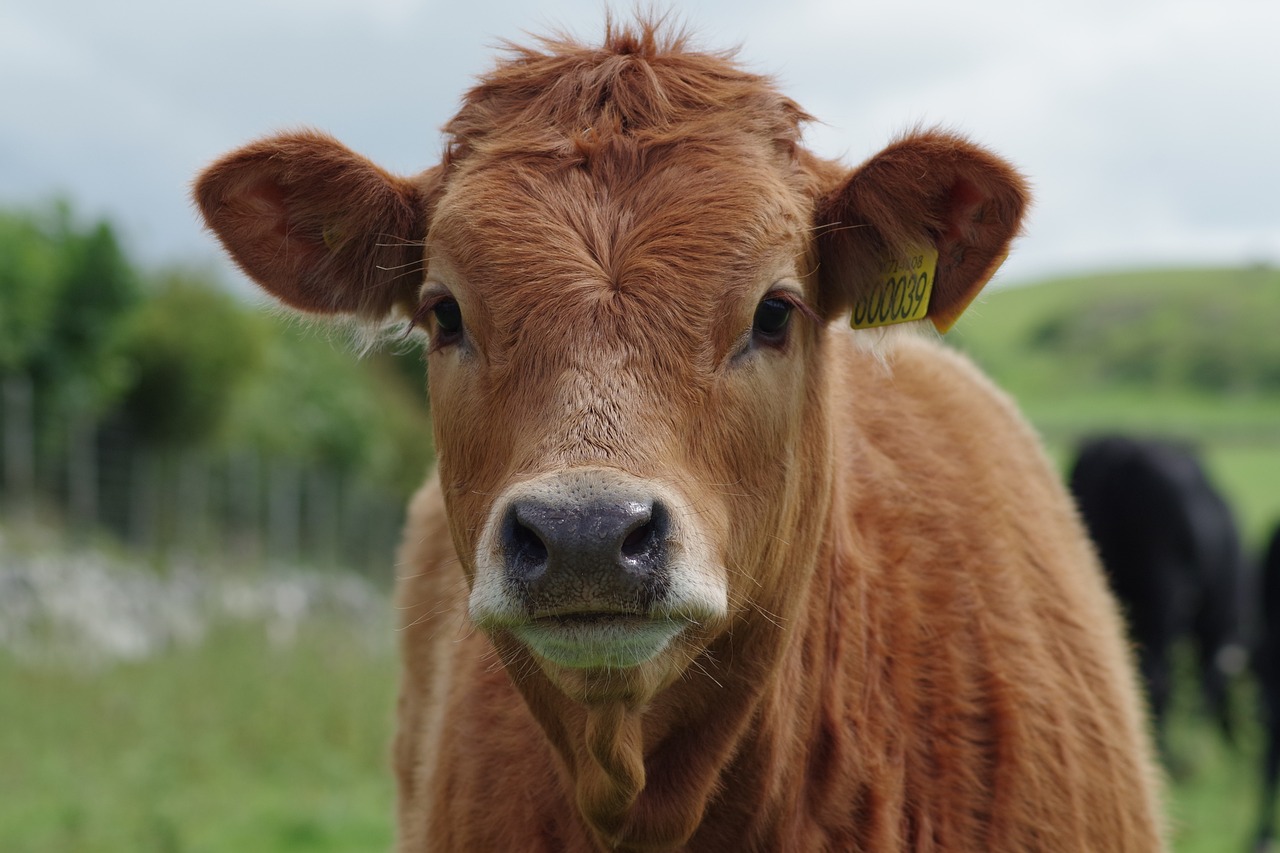
Cattle Extending Weakness to Friday
Live cattle futures are trading with $1.77 to $2.17 losses across most contracts on Friday. Cash trade started to pick up, with a few light northern sales...
Wheat Rallying Through Friday’s Midday
The wheat complex is reverting from Thursday weaker trade to post midday gains across the complex. Chicago SRW contracts are up 6 to 7 cents in most contracts....
Soybeans Holding onto Midday Gains, Following Slew of Export Business
Soybeans are rebounding from the Thursday weakness with contracts up 6 to 8 cents in most contracts at midday. The cmdtyView national average Cash Bean...