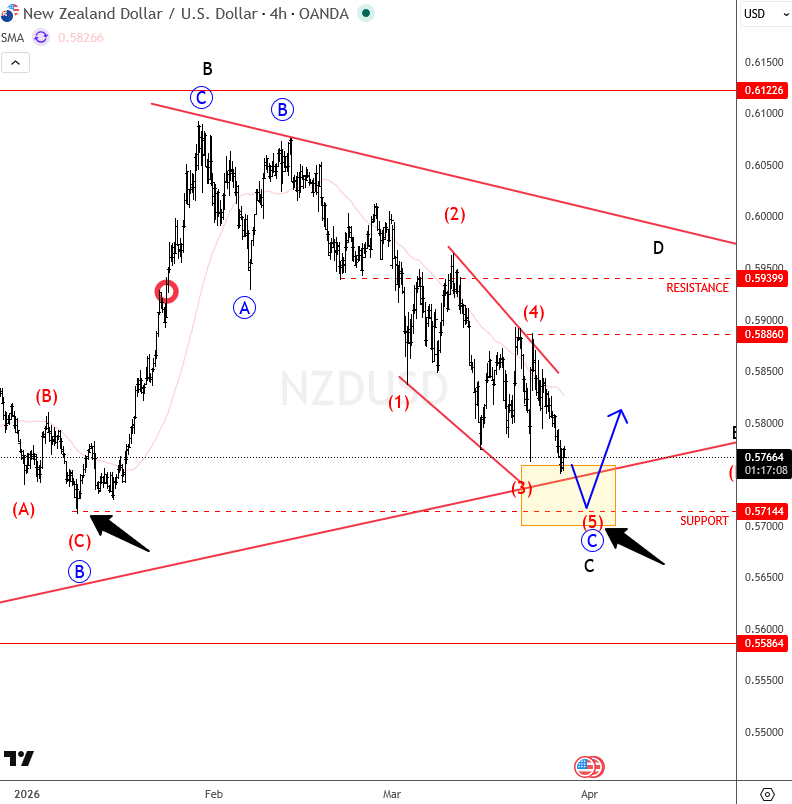
NZDUSD did not reach the 2025 highs, and the price has already turned back toward the 0.5850 area. The overlap in this region suggests that the overall price action since 2025 remains corrective, with a potential bullish ABCDE triangle still in play as our primary wave count. However, on a lower timeframe, the focus shifts to the current decline, which appears to be unfolding in a slow, overlapping manner, typical of a corrective structure. This move can be counted as an ABC decline within wave C. Within this leg, price action is potentially forming a wedge pattern, likely as part of wave C of C. As this structure matures, the market may look for support around the 0.5750–0.5700 area, near the lower boundary of the broader triangle.
www.wavetraders.com
For a detailed view and more analysis like this, you can watch below our latest recording of a live webinar streamed on March 23:

/Micron%20Technology%20Inc_billboard-by%20Poetra_RH%20via%20Shutterstock.jpg)

/A%20Palantir%20office%20building%20in%20Tokyo_%20Image%20by%20Hiroshi-Mori-Stock%20via%20Shutterstock_.jpg)
/Advanced%20Micro%20Devices%20Inc_%20logo%20and%20chart%20data-by%20Poetra_%20RH%20via%20Shutterstock.jpg)