
The markets were up on Wednesday, with all major indexes trading higher. The S&P 500 gained 0.5%, the Nasdaq 0.6%, the Dow 0.6%, and the Russell 2000 1.2%.
That’s an amazing feat given the precarious nature of the world at the moment. It’s hard to believe the Ukraine/Russia four-year-old war could get pushed to the back of the news, but that’s precisely what’s happened because of the war in the Middle East.
While wars have been the major storyline in 2026, software stocks have managed to attract a lot of attention; most of it bad, as investors fret about software stocks being made redundant by AI.
As a result, ETFs such as the iShares Expanded Tech-Software Sector ETF (IGV) have attracted considerable attention year to date. On Wednesday, IGV’s April 10 $86 call had the eighth-highest Vol/OI (volume-to-open-interest) ratio at 26.25.

While the volume for the call accounted for less than 10% of the ETF’s total and only 4.3% of its 30-day average of 104,520, its unusual options activity suggests IGV is at a crossroads. The question is whether the call is bullish or bearish.
Here’s my two cents.
The Demise of Software Stocks
If you’re unfamiliar with IGV, it tracks the performance of the S&P North American Expanded Technology Software Index, a collection of 113 companies, all but four (Canada) are based in the U.S.
Most of the constituents are software stocks with a smattering of interactive home entertainment and interactive media and services businesses. The index’s median market cap is $5.26 billion. By weight, Palantir Technologies (PLTR) is the highest at 9.29%, while Rapid7 is the smallest at 0.01%. The top 10 holdings account for 61% of the ETF’s $10.65 billion net assets.
IGV is down 24.82% in 2026. You have to go out three years to get a positive return of 31.93% since March 27, 2023. Since hitting its all-time high of $117.99 on Sept. 1, 2025, IGV has lost one-third of its value.
I’m not enough of a software industry expert to know whether AI is or isn’t the industry’s kryptonite. However, I find it hard to believe that large caps like Microsoft and Intuit won’t figure out how to use AI to their advantage, so I do believe IGV presents a value opportunity at current prices, but that’s not to say it doesn’t have more room to fall over the remainder of 2026. That depends on the geopolitical moves taking place at the moment.
The 5-year chart below highlights why IGV is at a crossroads.
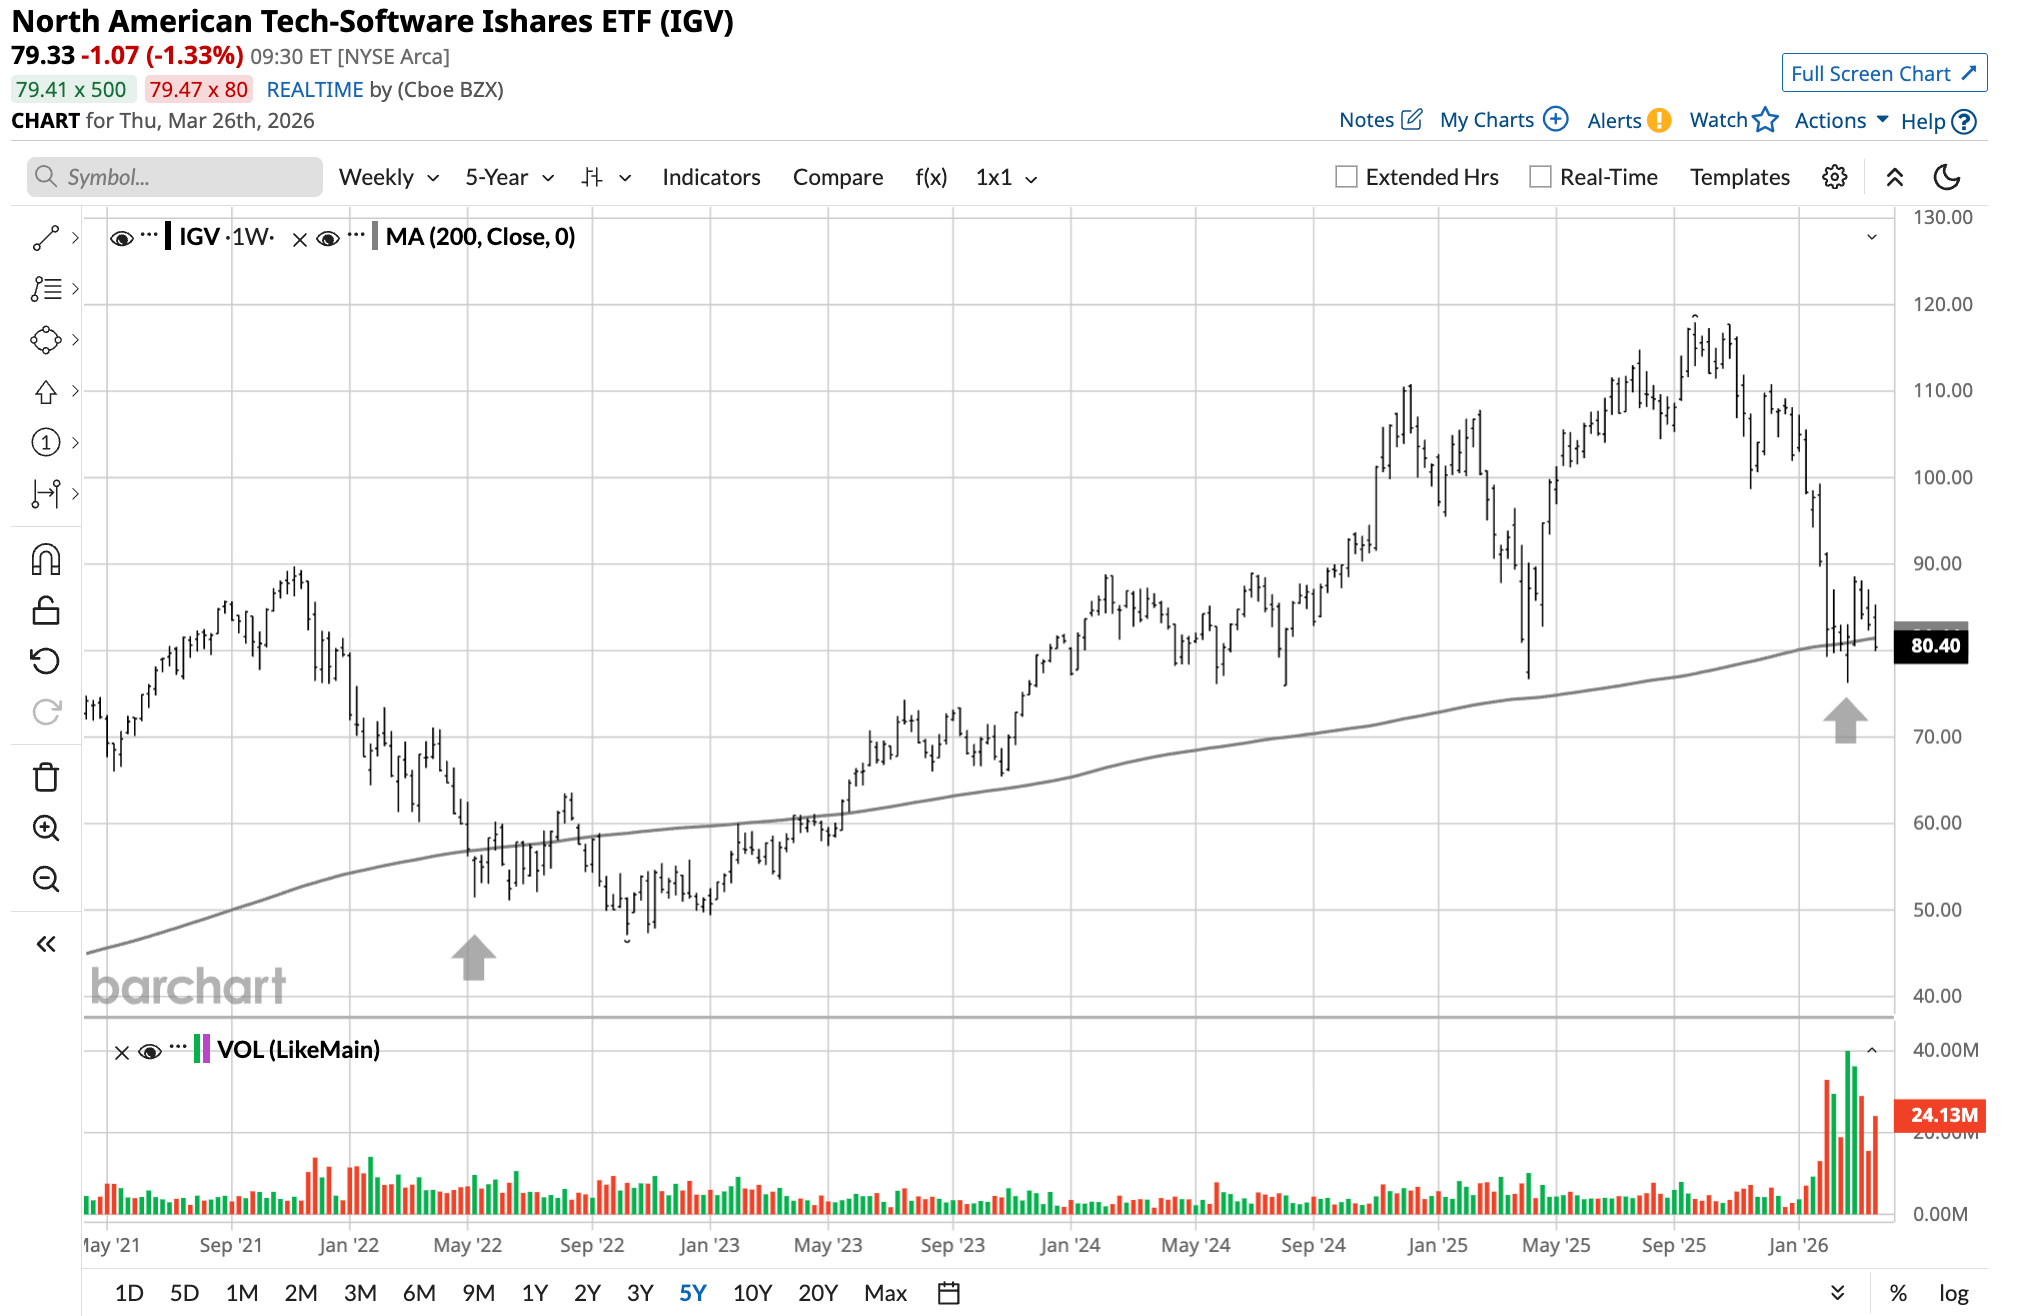
Source: Barchart.com
IGV’s share price over the past five years has fallen below its 200-day moving average (MA) on two occasions: May 2022 (left arrow) and Feb. 2026 (right arrow). In the first instance, it briefly went back above the 200-day MA, but was back below by that August; it then stayed below for nine months until mid-May 2023. Up until late February, it remained above the 200-day MA. As I write this early in Thursday trading, IGV’s share price is about 25 cents below the 200-day MA.
So, is IGV ready to go on another nine-month run trading below the 200-day MA? That’s the million-dollar question.
IGV’s April 10 $86 Call Is Bullish
As I said in the introduction, IGV’s April 10 $86 call traded 4,489 contracts yesterday, 26.25 times its open interest. The three trades below accounted for 92% of the call strike’s total.

As you can see from trade prices, two of the three were at the $0.95 ask price. That’s generally considered bullish. If the trades went for something closer to the $0.65 bid price, that would be a far more bearish indicator. The other trade was 10 cents above the $0.80 middle, so it was bullish too.
Within six minutes of the open this morning, a single trade for 2,286 April 10 $86 call contracts went through at $0.50, well down from yesterday’s trades at $0.95. Since the shares are down $1.26 from $82.21 yesterday, the lower ask makes sense. It has to make a larger move to be ITM (in the money) by April 10.
While the trade price this morning is down 45 cents from the three from yesterday above, it’s 45 cents higher than the $0.05 bid price, 15 cents higher than yesterday’s spread, which means, at least based on the one trade, that traders have gotten more bullish.
The expected move is $4.08 (5.1%). Based on an $81.05 share price, the upper price would be $85.13, not quite to the $86 strike. However, with a 0.1731 delta, and assuming the expected move occurs, were you to sell to close before April 10, your call’s value would be approximately $0.71 higher [$4.08 expected move * 0.1731], a return of 142%. Annualized, that’s 3,455.3% [142% return * 365 / 15 DTE].
Not too shabby.
IGV’s April 10 $86 Call Is Bearish
Referring to the 5-year chart from earlier, the first time IGV fell below the 200-day MA, it lost 49% of its value from peak to trough over 11 months. As already mentioned, its share price is down 33% from its all-time high last September.
So, if the drawdown is of similar duration and depth, IGV could fall for another four months and lose an additional $20.79 [$80.96 share price - ($117.99 * 49%)] in the process.
Of course, the call expires in just 15 days, with an expected move that’s about one-fifth of my hypothetical decline over four months, so that the loss would be limited to the $50 per call from today’s trade or $95 from three calls from yesterday. That’s a lot less than the $408 loss you'd incur if you actually bought 100 IGV shares.
What happened in 2022 that caused a big decline? Higher interest rates led to the rerating of software stocks and IGV, which had been on a three-year run from 2019 to 2021, generating an average annual return of 33.2% during that period, according to Morningstar. Add in stubborn inflation, which prompted recession talk, and in hindsight, you’ve got your answer.
This time, the threat of obsolescence has brought software stocks to their knees. The question for investors is whether we’re at the bottom.
What to Do?
After IGV’s big one-year decline between November 2021 and November 2022, its P/TBV (price-to-tangible book value) multiple went from 1.17x to 0.75x, a 36% decline. The current P/TBV multiple is 0.78x, almost identical to its low in November 2022.
Since the ETF’s inception in July 2001, the average annual P/TBV multiple for IGV has been lower only once: 2002, 16 months into its existence, at 0.77x.
I don’t know about you, but if you’re a value investor, it should be very hard to resist buying IGV at current prices.
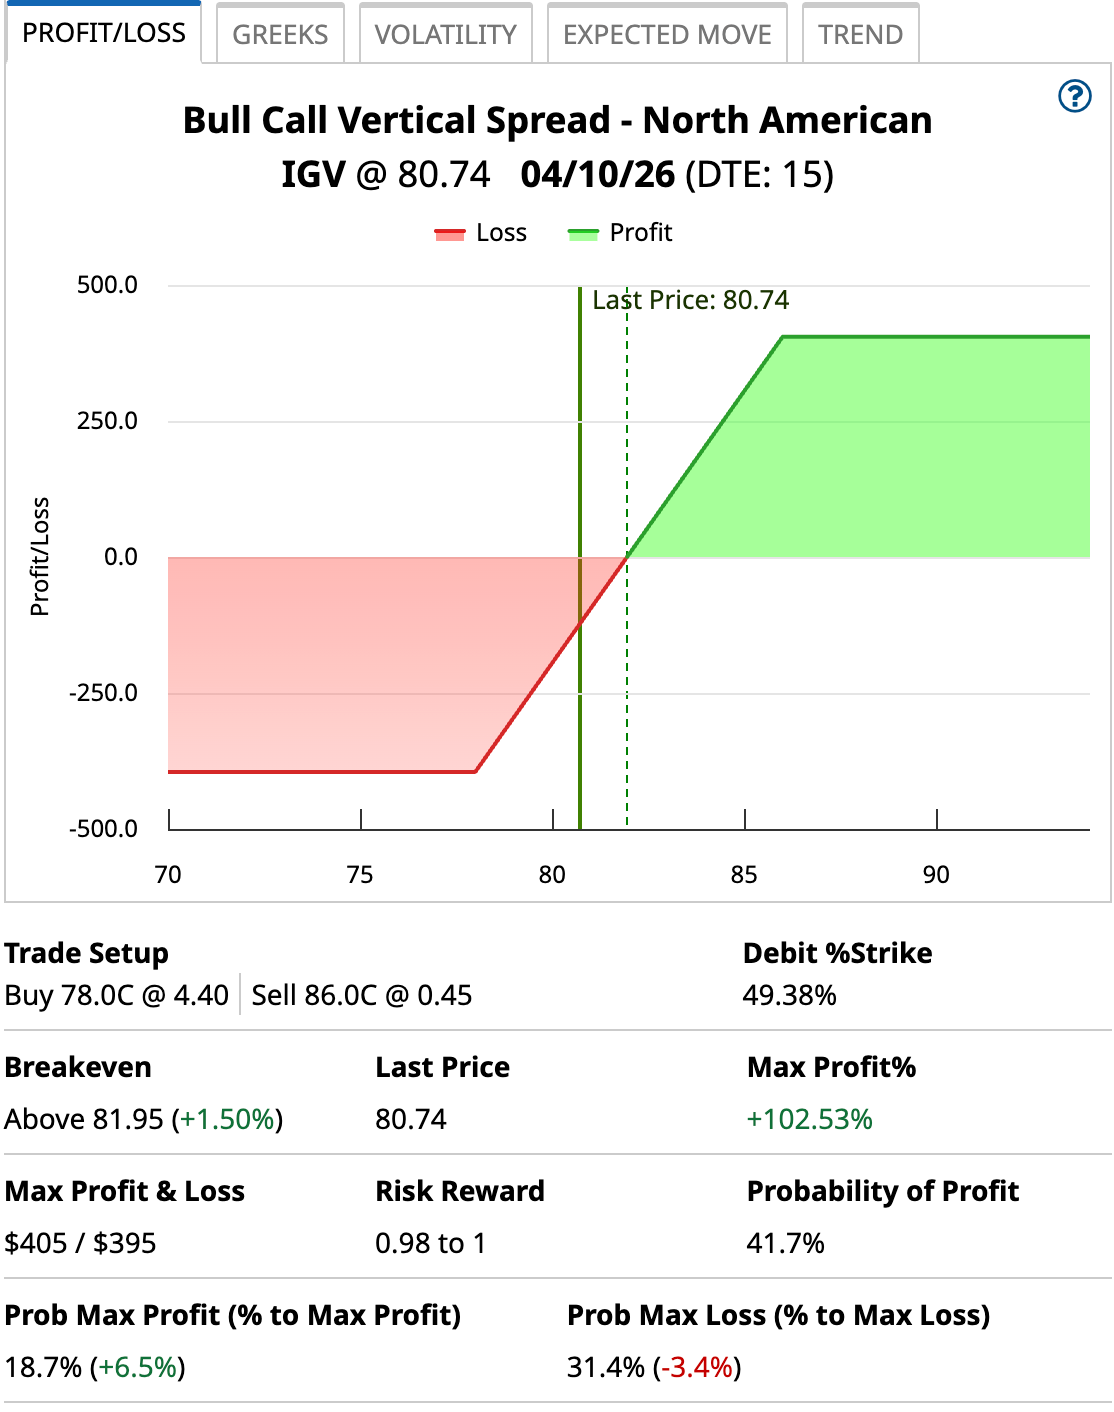
So, the three strategies to consider: 1) Buying $86 calls, perhaps going a little longer on the DTE than 15 days, 2) Doing Covered Calls by buying the shares at current prices and selling $86 April 10 $86 calls for a small premium, or 3) Do a Bull Call Spread, buying an April 10 $78 call and selling an $86 call, for a defined-risk bet that’s shown below.
The net debit of $3.95 gives you a breakeven of $81.95. The shares only have to gain 1.5% over the next 15 days to do that; there is a 41.7% chance it will happen. The most you can lose is $395, while the most you can profit is $405. That gives you a risk/reward below 1.0 and a maximum profit over 100%. It’s an excellent balance.
It’s the bet to make if you’re only mildly bullish in the near term.
On the date of publication, Will Ashworth did not have (either directly or indirectly) positions in any of the securities mentioned in this article. All information and data in this article is solely for informational purposes. For more information please view the Barchart Disclosure Policy here.
/AI%20(artificial%20intelligence)/Ai%20chip%20by%20Quality%20Stock%20Arts%20via%20Shutterstock.jpg)

/A%20hand%20holding%20a%20phone%20with%20the%20Reddit%20logo_%20Mamun_Sheikh%20via%20Shutterstock_.jpg)
/Seagate%20sign%20on%20the%20building%20atits%20operational%20headquarters%20By%20JHVEPhoto.jpeg)
/Apple%20logo%20on%20store%20front%20by%20frantic00%20via%20iStock.jpg)