
- The starting point in any discussion about supply and demand tables is to acknowledge they are filled with unknown variables.
- In the case of US soybeans, the biggest unknown is what 2021-2022 ending stocks/2022-2023 beginning stocks will actually be.
- After that, it doesn't take much imagination to come up with a negative ending stocks number for the 2022-2023 marketing year.
Imagine there’s no soybeans. It’s easy if you try. No risk below us, above us only sky. Imagine all the people, running out of soy. Ah…
A good friend sent me an imaginary soybean supply and demand table put together by another research company Wednesday evening. The point the group was trying to make was how little margin for error there is with the 2022 US soybean crop, a fact that seems to have caught many in the industry off guard despite the fact the Nov22-to-July23 futures spread has been inverted since last April. (All I can do is shake my head in amazement.) But, since the game USDA plays is to make up numbers and plug them into a table, let’s waste some time this morning by using our imagination and doing the same thing.
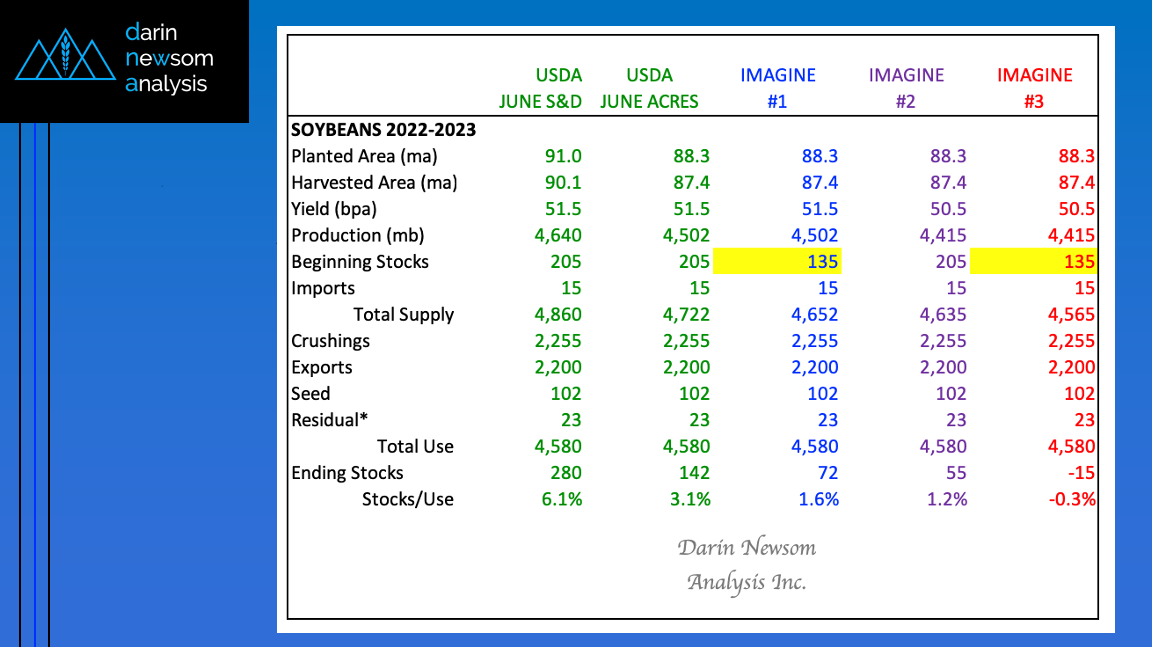
On the left-hand side of our table (green columns) you see the imaginary new-crop numbers USDA plugged into its June Supply and Demand report. The next column is a reimagining of what the July table could look like given USDA’s June 30 acreage update figure of 88.3 million (planted) and using the 99% to come up with harvested area of 87.4 million acres (ma). Leaving everything else the same, including a yield guess of 51.5 bpa, results in a decrease in ending stocks from 280 mb (June) to a theoretical 142 mb. But here’s where things get fun.
Recall from previous discussions my available stocks-to-use calculation for 2021-2022 soybeans is 3%, as compared to USDA’s June estimates resulting in a figure of 4.6%. Through the magic of imagination, and a little math, my calculation could put 2021-2022 ending stocks at 135 mb, a more reasonable number given basis, spreads, and so on. If we drop that number into the reimagined July table (blue column), 2022-2023 ending stocks suddenly drop to 72 mb.
But what if USDA’s imaginary 2022 average yield of 51.5 bpa is too high? What if, somehow, it actually comes in near 50.5 bpa? Using USDA’s overstated 2021-2022 ending stocks number of 205 mb as the beginning stocks figure again (purple column), new-crop ending stocks would still drop to 55 mb. On the other hand, using my old-crop figure of 135 mb takes 2022-2023 ending stocks into the red (fittingly enough, the red column).
Before we go much further, let’s talk about what is known and what is unknown variables at this time. In the “known” category we have – nothing, nada, zilch, zippo, and so on. In the “unknown” category is everything else. Given this, what are the key takeaways?
- First, these exercises in imaginary accounting are a complete waste of time (and my apology for wasting yours)
- Second, we know US ending stocks will not be allowed to go negative, regardless of the situation, meaning Residual Use will go negative to keep it from happening (hence the asterisk)
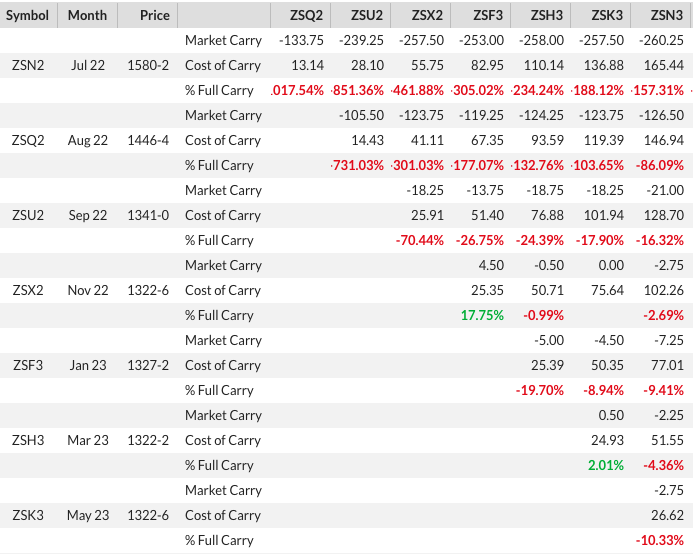
- Third, everything we need to know about real fundamentals is available to us every day in the form of basis, futures spreads, and forward curves.
“You may say I’m a dreamer/But I’m not the only one/I hope someday you’ll join us/And the world will live as one.”
More Grain News from Barchart
/Dell%20Technologies%20by%20Poetra_RH%20via%20Shutterstock.jpg)
/The%20sign%20for%20Marvell%20Technology%20out%20front%20of%20a%20corporate%20office%20by%20Valeriya%20Zankovych%20via%20Shutterstock.jpg)

/Intel%20Corp_%20badge%20holder-by%20hasrul_rais%20via%20Shutterstock.jpg)
