
On May 4, in an article on Barchart, I highlighted how copper’s price broke through the bottom end of its trading range. Copper had made a new record high in March when the price briefly probed above the $5 per pound level for the first time. In that article, I wrote, “I am a scale-down buyer of copper and copper mining shares from the current price levels, leaving plenty of room to add to long positions…I never look to pick bottoms in any market. However, the fundamentals for the copper market and potential higher highs are compelling for the coming years, justifying the risk of a buying program during the current selloff.”
Copper was at the $4.30 level on May 4, and the price made a lower low since then. Meanwhile, I am sticking with the buying program as copper is the critical metal for the world’s decarbonization plans.
A lower low- Copper holds above the $4 per pound level
July copper futures reached $5.01 per pound on March 7, when they ran out of upside steam.
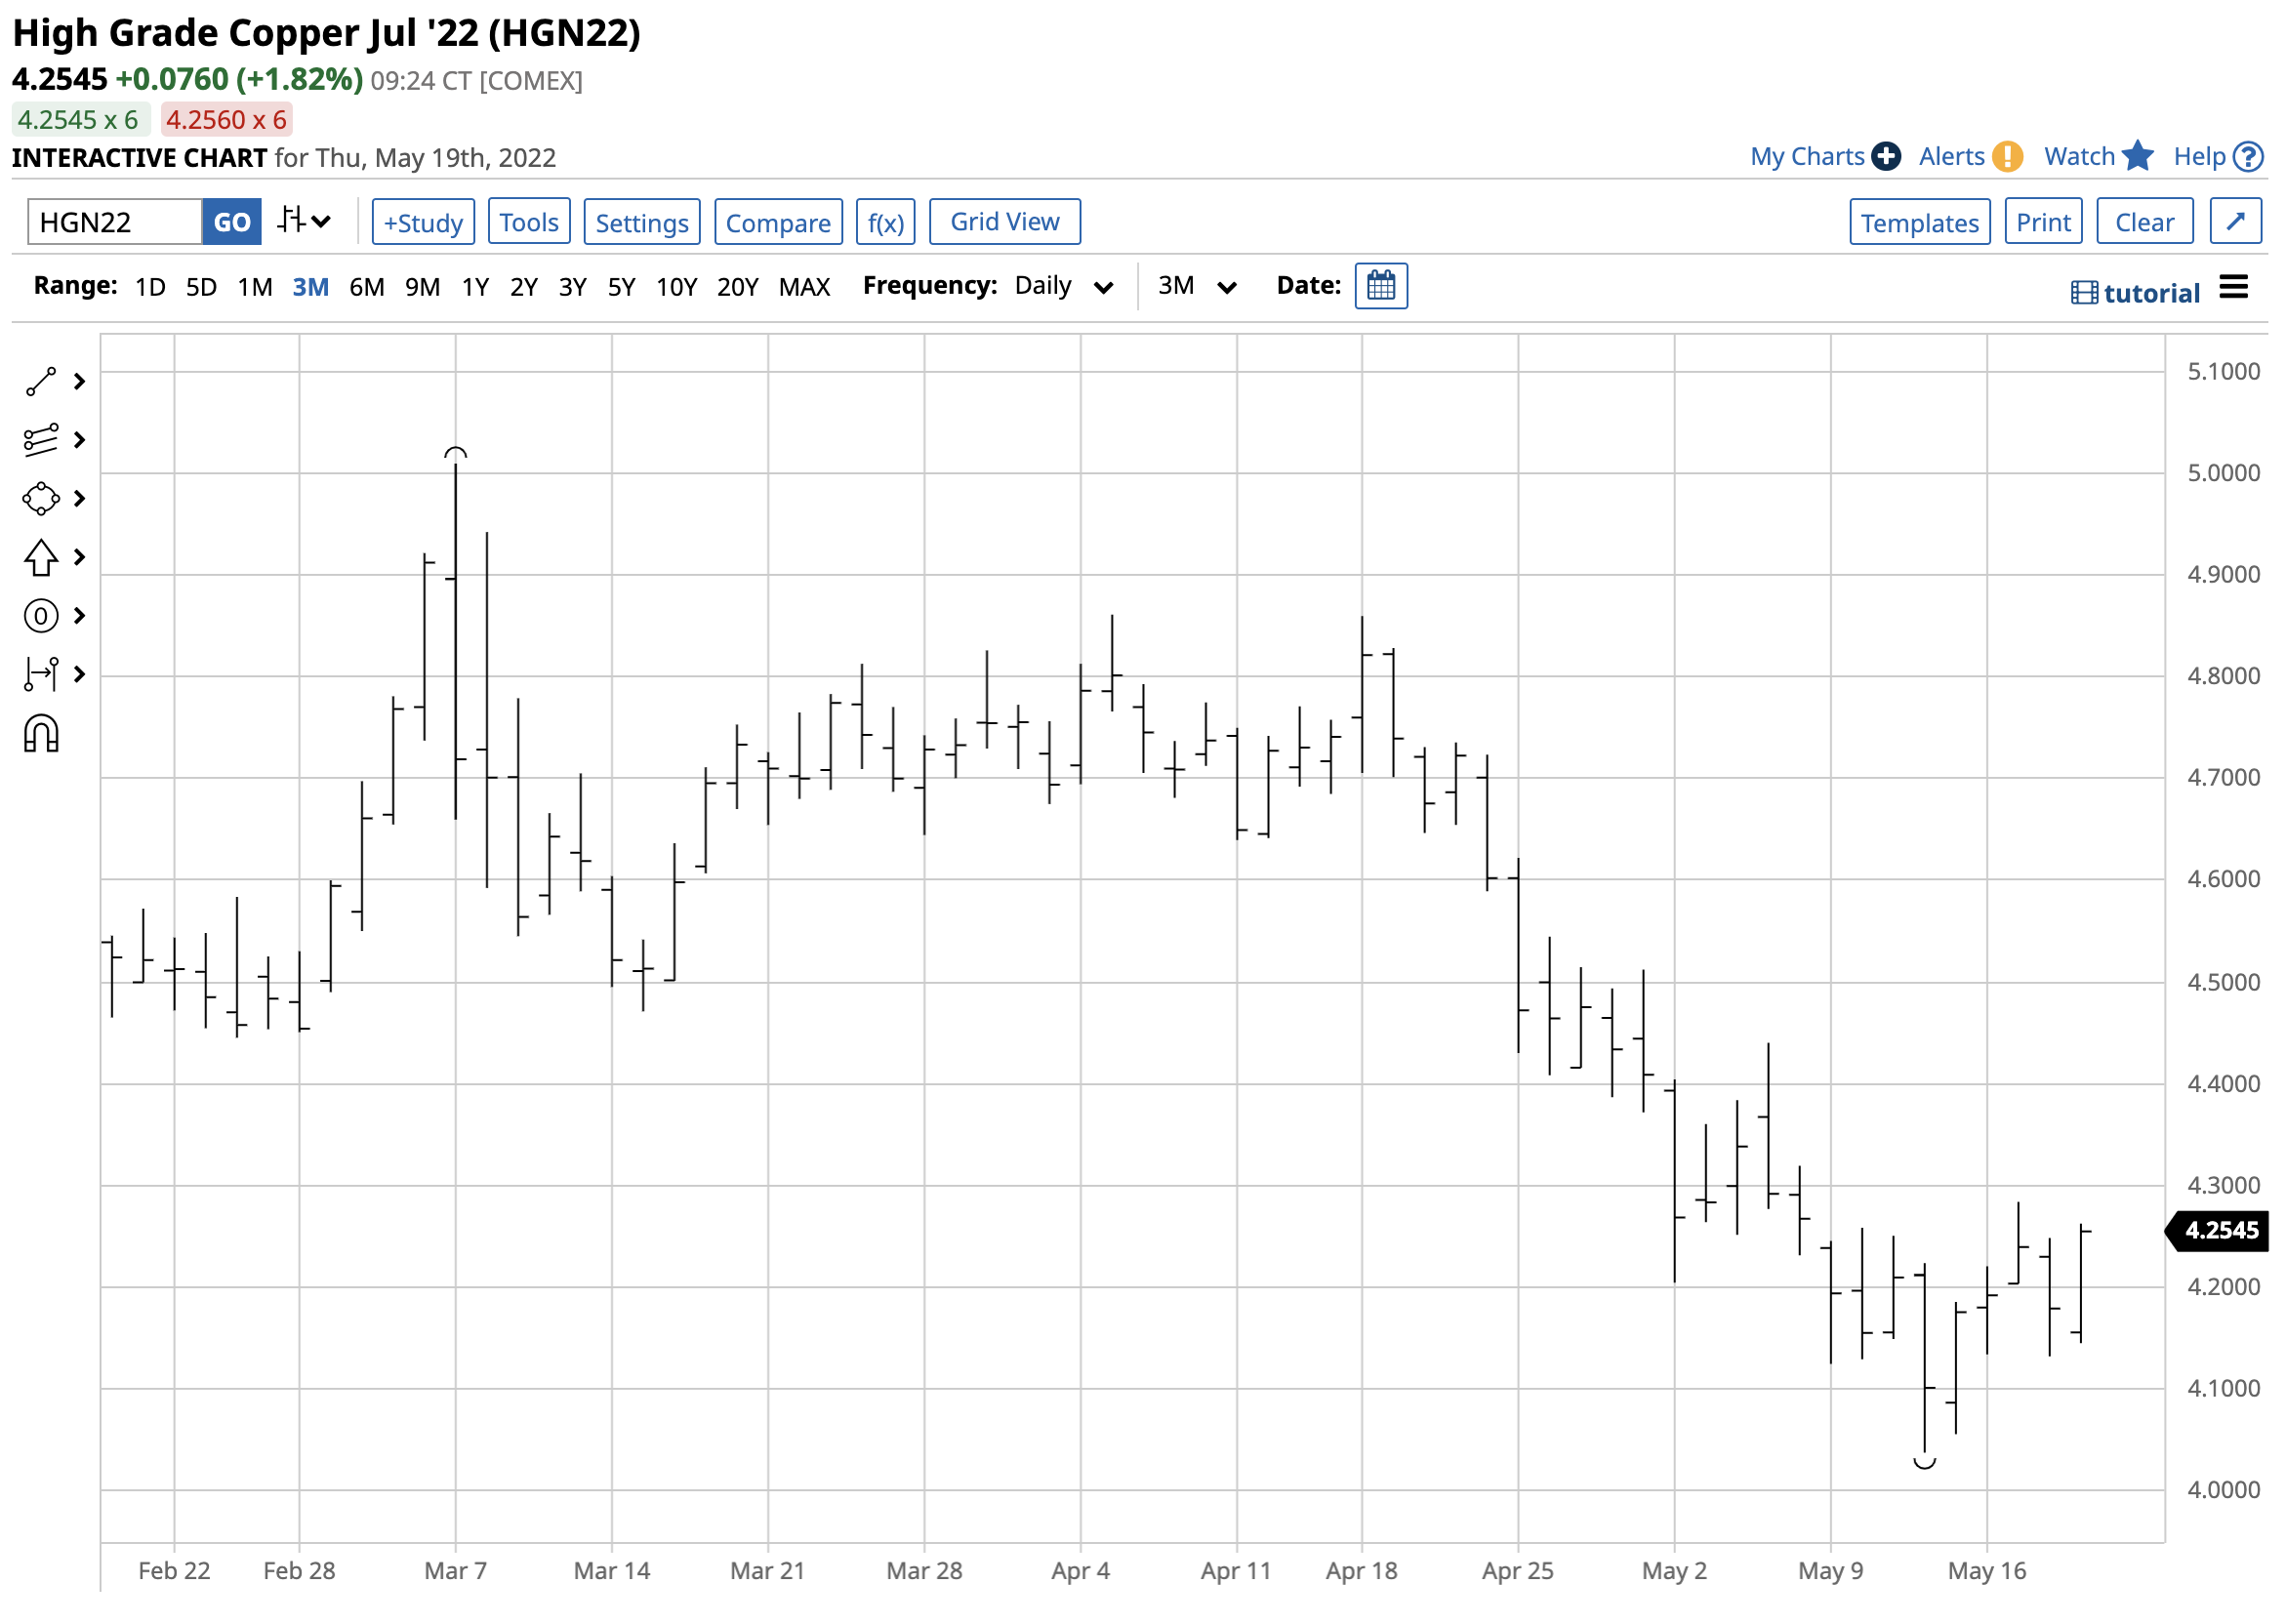
The chart illustrates July copper futures traded in a range from $4.4710 to $4.8615 from March 9 through April 25, when they fell through the bottom of the range. Copper reached its most recent low at $4.0370 on May 12 and was near the $4.25 per pound level on May 19. Copper came close but did not yet challenge the $4 level.
Copper tends to stick to technical support levels
Commodities are volatile assets, and many tend to violate technical levels during corrections or rallies. Copper has been particularly obedient to support levels over the past years.
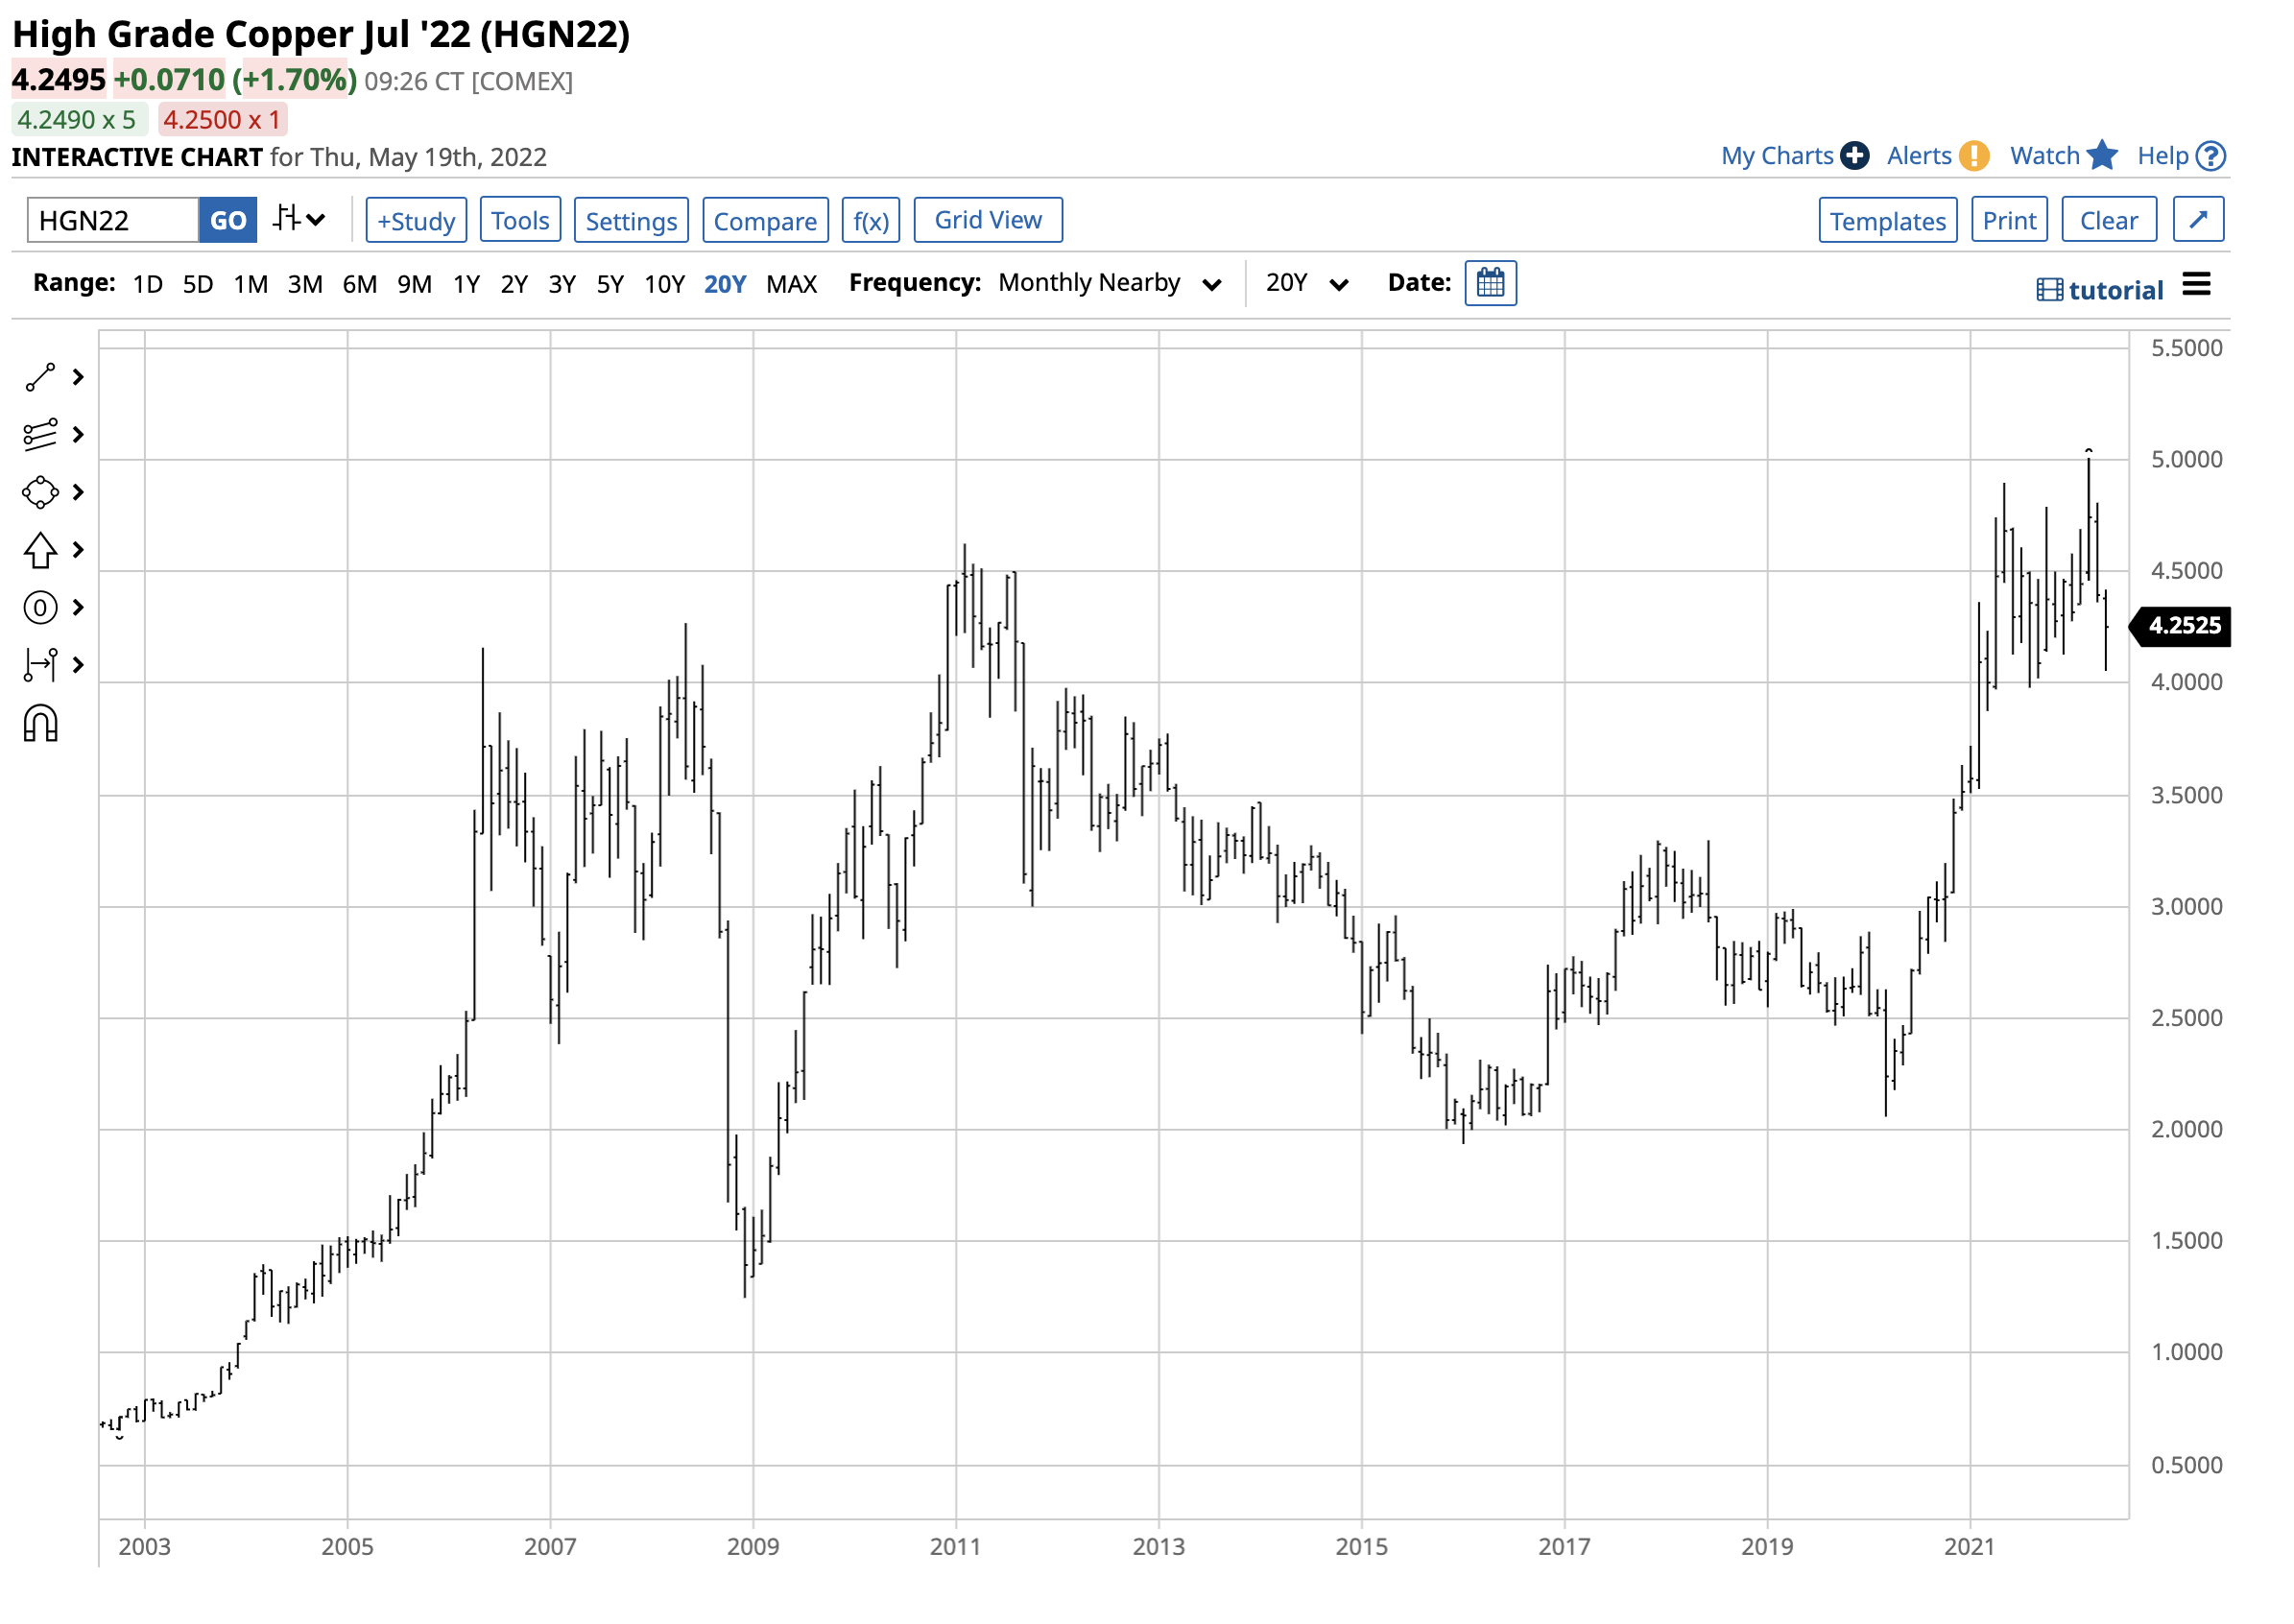
The chart shows that copper reached a low of $1.9365 per pound in January 2016, which was a critical support level as the early 2020 pandemic-inspired selling hit markets across all asset classes. In March 2020, copper fell to $2.0595, making a higher low when many other raw material prices violated significant technical levels. The higher low was a launchpad for the copper market as it rose to a series of new record highs in May 2021 and March 2022.
The most recent May 12 low at $4.0370 was above the August 2021 bottom at the $3.98 level. As of May 19, copper continued to respect critical downside technical support levels.
The world cannot turn on new production quickly
The demand for copper in electric vehicles, wind turbines, and other green energy initiatives and infrastructure building is growing at a rate where production cannot keep pace with the demand. Goldman Sach’s analysts forecast that copper’s price would rise to the $15,000 per ton level by 2025, putting COMEX futures at over $6.80 per pound. With July futures at the $4.25 level on May 19, they expect copper to be 60% higher over the coming years, keeping the trend of higher lows and higher highs intact.
While demand is increasing, it takes nearly a decade to bring new mines into full production. While the world’s leading copper producers are scouring the earth for proven and probable reserves, new finds will not increase the flow of copper until 2030. The copper market is heading for a fundamental deficit when inflation is pushing raw material prices higher.
Production costs continue to rise
Copper production is energy-intensive. Ironically, while copper is critical for decarbonization, hydrocarbons are crucial for extracting the ores from the earth’s crust and the smelting and refining process that produce the metal. Production costs have soared, with crude oil above $105 per barrel, natural gas at over $8 per MMBtu, and coal at the highest price in years. Moreover, labor, equipment, and other input expenses have moved appreciably higher over the past year, pushing the cost of producing each pound of copper higher. Rising production costs when the demand increases create a potent bullish cocktail for copper’s price.
Watch China- The end of lockdowns could ignite the next rally
Meanwhile, China remains the world’s leading copper consumer. Geopolitical tensions between China/Russia and the US/Europe will likely increase competition for copper supplies. The world’s leading copper exchange is the London Metals Exchange. Ironically, the Chinese have owned the LME since the 2013 purchase.
One of the factors weighing on copper has been the COVID-19 lockdowns in Shanghai, Beijing, and other populous Chinese cities, grinding business activity to a halt. Since the lockdowns began, copper inventories have been increasing.
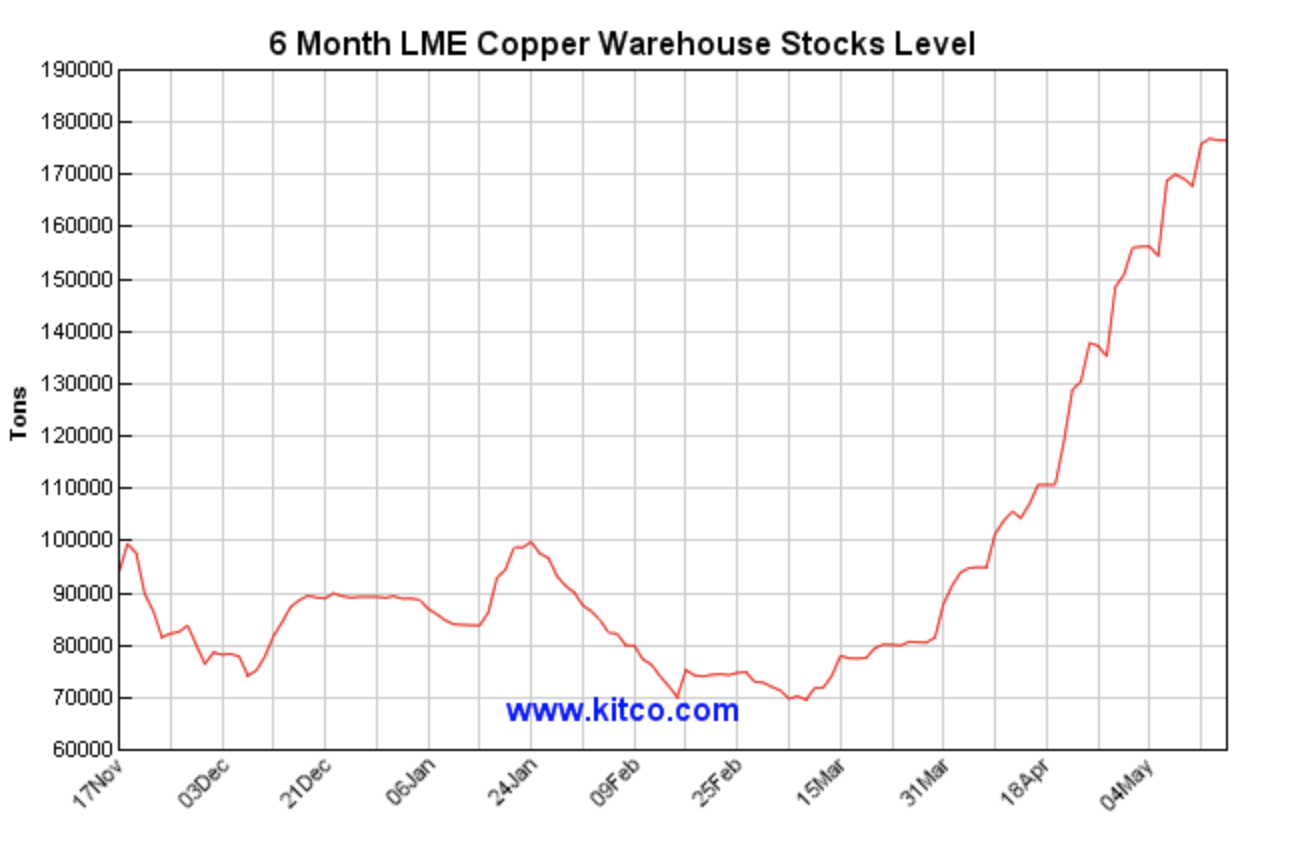
Source: LME/Kitco
The chart shows that LME inventories rose from the 70,000-ton level in mid-March 2022 to over 180,000 metric tons on May 18.
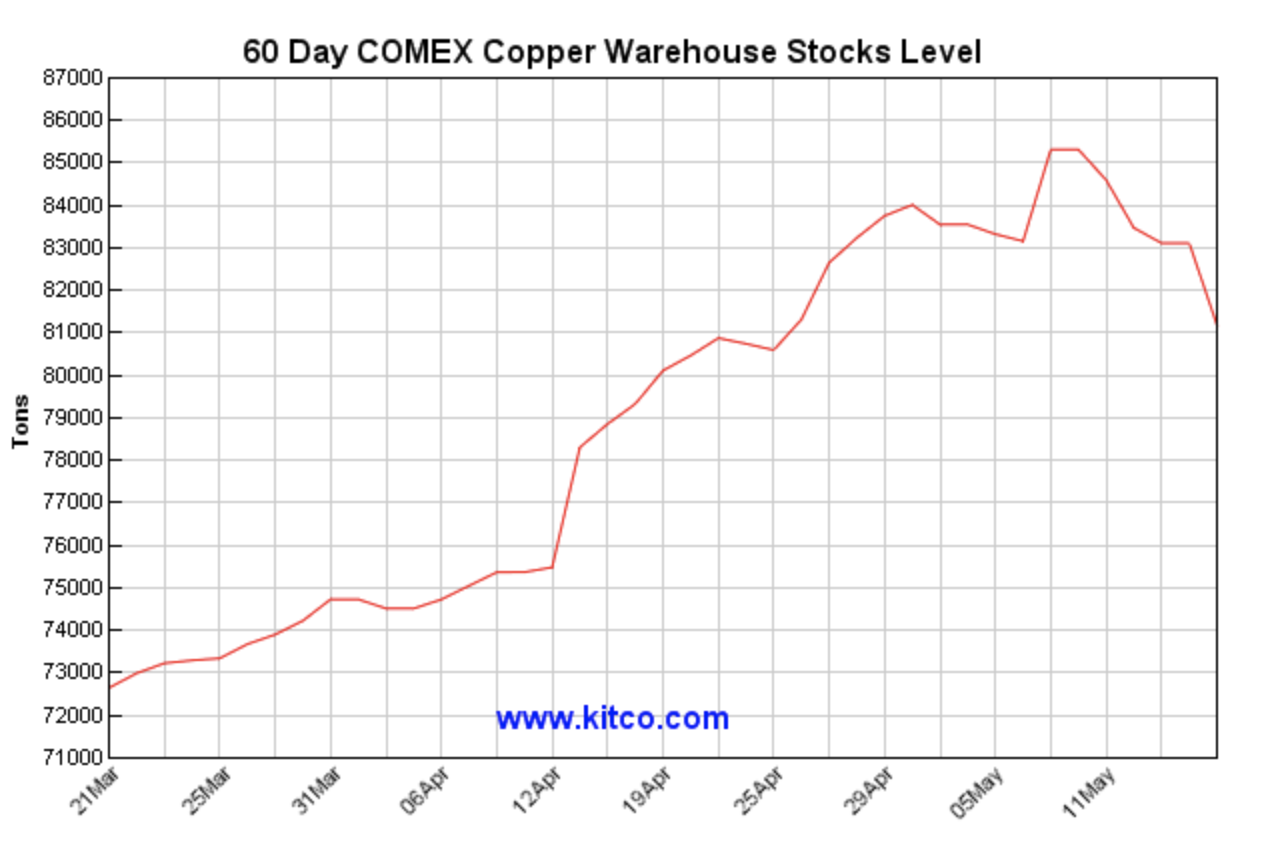
Source: LME/Kitco
Copper in COMEX warehouses rose from 72,000 tons in mid-March to over the 81,000 level as of May 18. Rising inventories could reflect the demand slowdown caused by Chinese lockdowns.
The long-term trend in copper remains bullish during the current correction. Technically, copper must hold above the August 2021 $3.98 low to keep the bullish pattern intact. I expect the price to resume its upward trajectory when China emerges from its COVID-19 lockdowns, putting copper back on the path to another record high and towards Goldman Sachs’s target price at over the $6.80 per pound level. I continue to favor buying dips in the copper market.
/Advanced%20Micro%20Devices%20Inc_%20office%20sign-by%20Poetra_RH%20via%20Shutterstock.jpg)
/Chipset%20held%20over%20rush%20hour%20traffic%20by%20Jae%20Young%20Ju%20via%20iStock.jpg)


/The%20sign%20for%20Marvell%20Technology%20out%20front%20of%20a%20corporate%20office%20by%20Valeriya%20Zankovych%20via%20Shutterstock.jpg)