The information and opinions expressed below are based on my analysis of price behavior and chart activity
Sign Up to receive Walsh Trading’s 1st Half of 2026 Market Outlook First Half of 2026 Outlook for the Livestock and Grain markets.
Tuesday, March 10, 2026
July Soybeans (Daily)
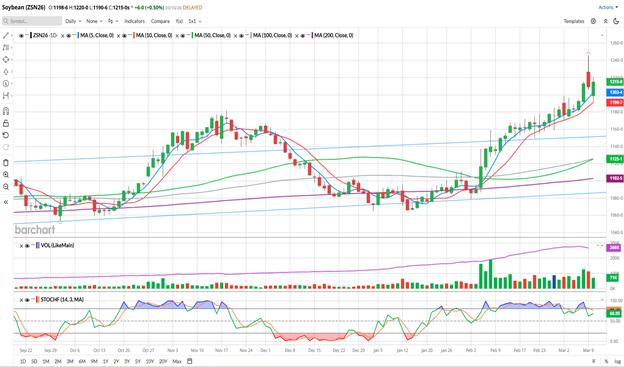
July Soybeans closed at 12.15 today, gaining 6 cents from Monday. This marks the highest daily close on this chart view and the highest close in the July contract since May of 2024! This week started with a strong rally on Sunday night, but faded back during the day as Crude Oil prices ripped lower. Monday’s bar certainly seems bearish to me, closing some 36 ¾ cents off of the high, but prices have rebounded today and the uptrend remains intact.
Today the USDA released their monthly Supply/Demand estimates and the market responded with a yawn. They made no significant changes to the US balance sheet and kept their season-average price at $10.20 Imports were raised by 5 million bushels and crush was also raised by 5 million bushels, on strong domestic Soymeal demand. Their Brazilian estimate they left alone at 180.00 MMT but they did reduce Argentina’s estimate by 500K to 48.0 MMT. World ending stock were pegged slightly lower than previous data, at 125.31 MMT. Harvest in Brazil is a little behind schedule, but the images of the lines of full truck waiting to be unloaded is staggering. I know my US customers don’t like waiting in line at their local elevators, but could you imagine sitting in line for days? Yeah, no, neither can I. The South American crops are large and coming to ports soon. If the world looks to Brazil for harvest Beans, that could give some bearish pressure. The other side of that coin could be that when a market is trending strong, fundamentals and seasonal patterns get tossed out the window.
Also keep an eye on the weather as we head into planting season here in the US. The drought map shows stress across most of Nebraska, Iowa, Missouri, Illinois, Indiana and stretches into Ohio. The drought concerns also extend across the entire south of the nation, from New Mexico to the Atlantic. If timely rains don’t come, that will allow planting to go quickly, but will likely impact potential yields. If a drought materializes this year, that could push prices significantly higher still.
Recently, the Bean market has been spurred higher by the price activity in the Crude Oil. I think you’d be hard pressed to find a market that hasn’t been driven by silly high prices for Energy. Farmers seem to be faced with the prospects of much higher fertilizer, fuel and chemical bills, if they haven’t already booked their needs as we head into the spring planting season. A rally in fuel prices just before planting is not ideal. If the war with Iran extends for longer than anticipated, those inputs may continue to skyrocket. I’m not sure anyone outside the DOW has a good idea of how long this is supposed to go on, but most folks that I talk with don’t expect it to last long. But if I recall correctly, many people said the same about Russia/Ukraine and that conflict continues, still. The Straits of Hormuz are a vital pathway for the world trade, and not just Oil. Obviously, it remains to be seen if/how this will all work out.
Technically speaking the Bean market appears relatively strong. New highs for the move were made yesterday. The 5- and 10-day moving averages (blue/red) have been in a bullish configuration since January 22nd, when they made a bullish crossover. Those averages are at 12.02 ½ and 11.90 7/8, respectively, and both were tested (and held) as support today. The 50- and 100-day moving averages displayed above (green/gray) are thisclose to also making a bullish crossover and are both between 11.25 and 11.26. If prices stay firm this week, I would fully expect them to cross to bullish, which may induce some fund-related buying. The 200-day average (purple, 11.02 5/8) is well below the market, but all of the averages on the chart are inclined toward higher prices. Stochastics (bottom sub-graph) have ticked down from overbought this week, which may have triggered some selling pressure, but today’s activity saw the faster component turn back up. By my rough count, this market has preferred to be overbought over the view of this chart by about a 3:2 ratio.
July Soybeans (Weekly)
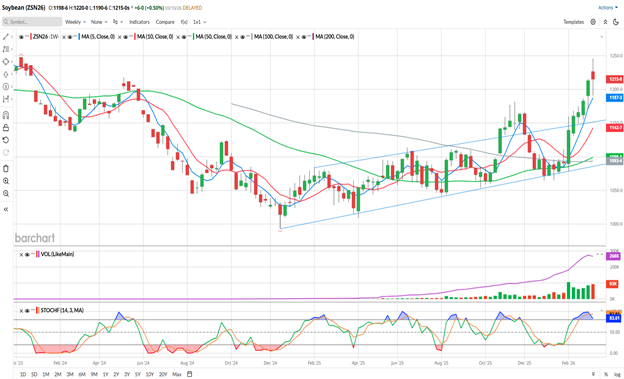
The most newly notable thing about the weekly chart, to my eye, anyhow, is that the 50- and 100-week moving averages (green/grey) made a bullish crossover with last week’s close. The market broke out of the trading channel (blue horizontals) the 2nd week of February. Instead of losing momentum, like the market did on the first breakout in October/November we’ve seen the prices accelerate higher. Certainly, a good chunk of that move has come from the uncertainty of war, but not all of it. Beans have posted higher highs and higher lows every week since then. This week’s trade has also filled a gap, way over to the left, at 12.20 ½, that’s been there since Christmas 2023.
Aggressive and very well-margined traders may do well to consider long positions in July Soybeans. Following along with the Bullish Crossover of the 50/100 week averages, the longer-term trend has turned higher. I would suggest entering on a dip/test of the 5-week moving average near the 11.88 mark. Rather than a straight sell-stop managing the downside risk, I would suggest buying the July 11.50 Puts to protect your equity and avoid whipsaws. Those options expire in 108 days. The 11.50 Puts have a delta of -0.32, so you’ll need at least two, if not three of those to adequately protect a futures position. They settled at 20 3/8 today, or $1,018.75 per option, before your commissions/fees. I would leave the upside target open, for now, in order to see if the 50/100 crossover is just the beginning of a longer-term move. Keep in mind that the Soybean market has been trending lower since May 2022 and the 50/100 week averages have been in a bearish configuration this whole time. Until now. If this works out the way that I think it might, this could be the start of a long-term bullish position. Look at the “weekly nearby” chart here on Barchart to see that. (not pictured)
You can view Barchart’s Seasonal Data for July Beans here.
Sign Up to receive Walsh Trading’s 1st Half of 2026 Market Outlook First Half of 2026 Outlook for the Livestock and Grain markets.
If you like what you’ve read here and would like to see more like this from Walsh Trading, please Click here and sign up for our daily futures market email.
Jefferson Fosse Walsh Trading
Direct 312 957 8248 Toll Free 800 556 9411
jfosse@walshtrading.com www.walshtrading.com
Walsh Trading, Inc. is registered as a Guaranteed Introducing Broker with the Commodity Futures Trading Commission and an NFA Member.
Futures and options trading involves substantial risk and is not suitable for all investors. Therefore, individuals should carefully consider their financial condition in deciding whether to trade. Option traders should be aware that the exercise of a long option will result in a futures position. The valuation of futures and options may fluctuate, and as a result, clients may lose more than their original investment. The information contained on this site is the opinion of the writer or was obtained from sources cited within the commentary. The impact on market prices due to seasonal or market cycles and current news events may already be reflected in market prices. PAST PERFORMANCE IS NOT NECESSARILY INDICATIVE OF FUTURE RESULTS. All information, communications, publications, and reports, including this specific material, used and distributed by Walsh Trading, Inc. (“WTI”) shall be construed as a solicitation for entering into a derivatives transaction. WTI does not distribute research reports, employ research analysts, or maintain a research department as defined in CFTC Regulation 1.71.

/A%20close-up%20of%20a%20SpaceX%20sign%20by%20Sundry%20Photography%20via%20Adobe%20Stock.jpeg)

/AI%20(artificial%20intelligence)/AI%20chip%20by%203Dsss%20via%20Shutterstock.jpg)
/Data%20codes%20through%20eyeglasses%20by%20Kevin%20Ku%20via%20Pexels.jpg)