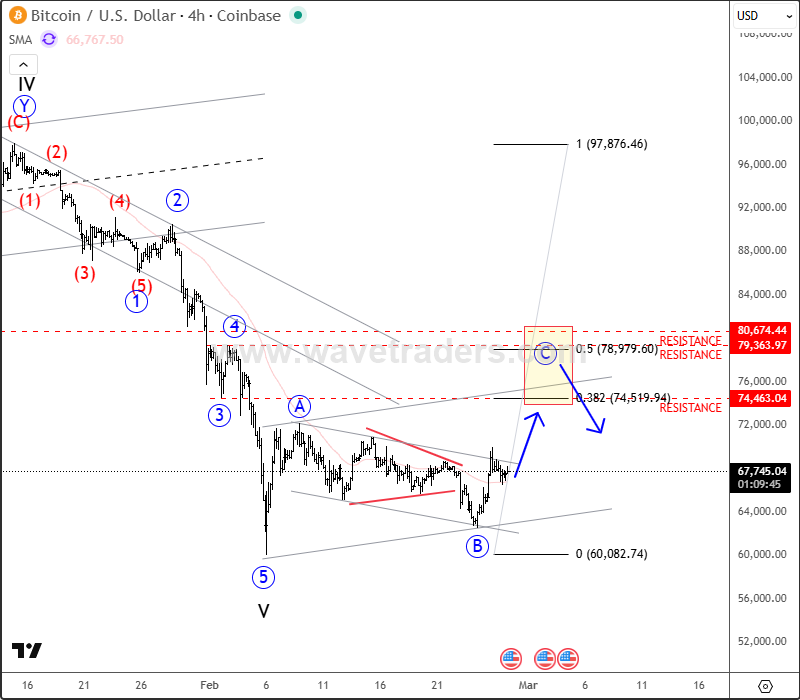
We talked about Bitcoin on February 27, where we mentioned and highlighted an ongoing ABC recovery after a completed five-wave bearish impulse.
www.wavetraders.com
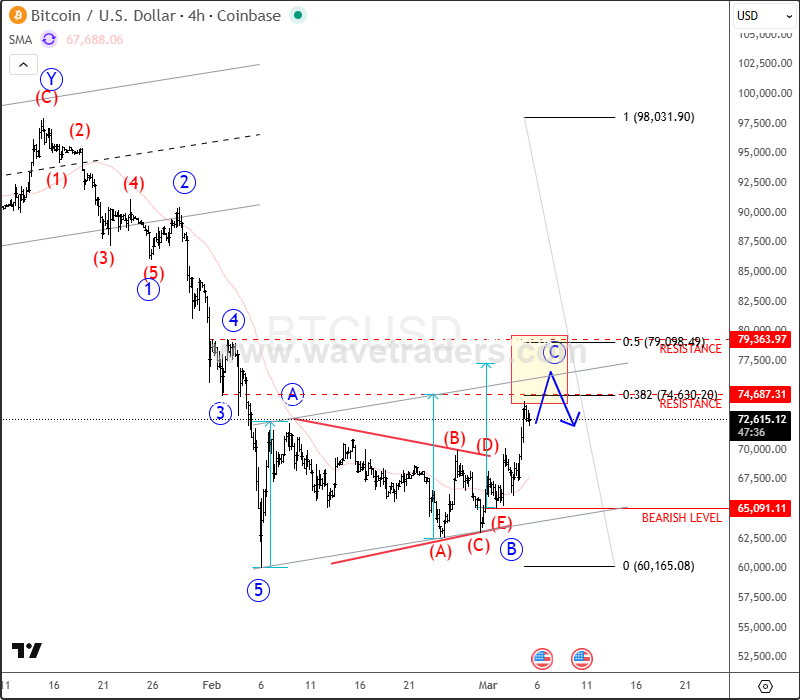
On the 4-hour chart, Bitcoin continues to recover within a three-wave ABC corrective rally. After the previously projected bullish triangle pattern in wave B, price has moved higher and appears to be progressing through wave C. The current move is targeting the first projected resistance zone between 74K and 80K, where a potential reaction or bearish continuation could emerge. However, for bears to regain control, we would need to see a sharp and impulsive decline back below 65K, which would signal renewed downside pressure. If the recovery extends further, the next resistance zone for a higher-degree corrective rally sits between 90K and 100K.
www.wavetraders.com
For a detailed view and more analysis like this, you can watch below our latest recording of a live webinar streamed on March 02:
/Alphabet%20(Google)%20Image%20by%20Markus%20Mainka%20via%20Shutterstock.jpg)


/Chipset%20held%20over%20rush%20hour%20traffic%20by%20Jae%20Young%20Ju%20via%20iStock.jpg)