
With the U.S. and Israel launching a joint military attack on Iran, this one macro catalyst obviously carries massive implications for global markets. Given the many uncertainties that this conflict has sparked — particularly for energy prices and their downwind economic consequences — sector stalwarts like Walmart (WMT) look relatively attractive. But how you go about trading WMT stock matters and that’s where the triage approach comes to mind.
As you might expect, the big-box retailer was the subject of several notable transactions within Barchart’s unusual options screener. Overall, most of the trades focused on short-term positioning around the spot price, potentially indicating tactical exposure rather than outright directional conviction. Sure, there were some trades that would be classified as “hopeful” but most of the participation appeared deliberate and disciplined.
A more critical indicator came from the volatility skew of WMT stock. Definitionally, volatility skew identifies implied volatility (IV) — or a stock’s potential range of motion — across the strike price spectrum of a given options chain. Stated differently, the skew provides a visual interpretation of the surface-area distortion of volatility space, allowing retail traders to understand how the smart money is managing its risk profile.
I’d argue that volatility skew is the most important indicator to study among all the traditional options-related indicators because of its broader implications. For example, I don’t really pay attention to IV as its own indicator. If IV is high, it just means that the market expects movement. By contrast, the skew tells you where the market is pricing that movement.
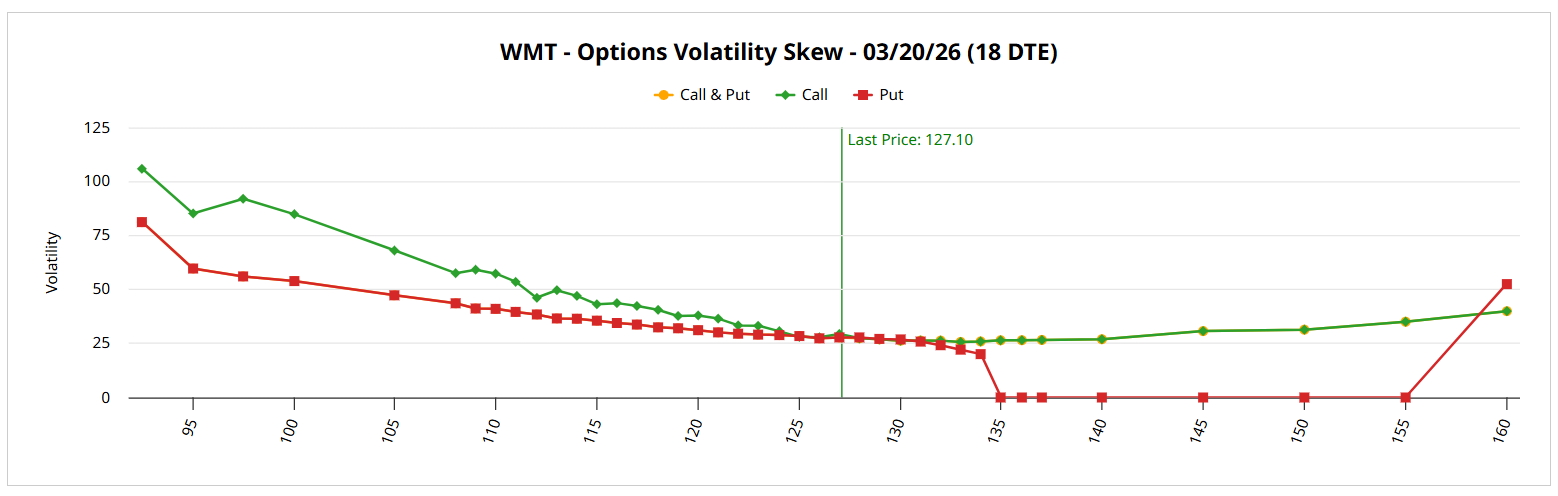
For WMT stock, the upcoming March 20 monthly options chain reveals that the skew is very controlled but has an upward bias at the left-hand boundaries (toward lower strikes). While no one is panicking, the smart money is more concerned about protecting against a big loss than it is positioning for a big gain.
How the Triage Method Helps You Trade WMT Stock
While we may have an understanding of smart money risk positioning for Walmart stock, we need some way of translating this intel into a usable forecast. As a beginning reference point, we can use the Expected Move calculator, which incorporates data like IV into its estimations. For the March 20 expiration date, the calculator anticipates a dispersion between $121.62 and $132.58.
Still, as I pointed out, this dispersion is a reference. As analysts, we need to figure out whether this reference reflects the reality imposed by the current sentiment regime of the market. To the best of my knowledge, there is neither a calculator nor a screener that identifies regime-contextualized probabilities. It’s here that you need the (human) analyst to help sift through the noise.
This is where the triage method is very helpful. As you know, WMT stock is a stalwart, one of the economic bellwethers. Therefore, we can reasonably assume that the sentiment structure of the benchmark S&P 500 Trust ETF (SPY) will trickle down to how risk is managed for WMT.
I believe this dynamic is especially meaningful for massive macro events like the Iran strike. Essentially, fund managers hedge their risk at the index level first before the risk positioning hits individual names like WMT stock. Sure enough, by analyzing the SPY ETF’s volatility skew (for the same March 20 expiration date), we find similar risk-management dynamics.
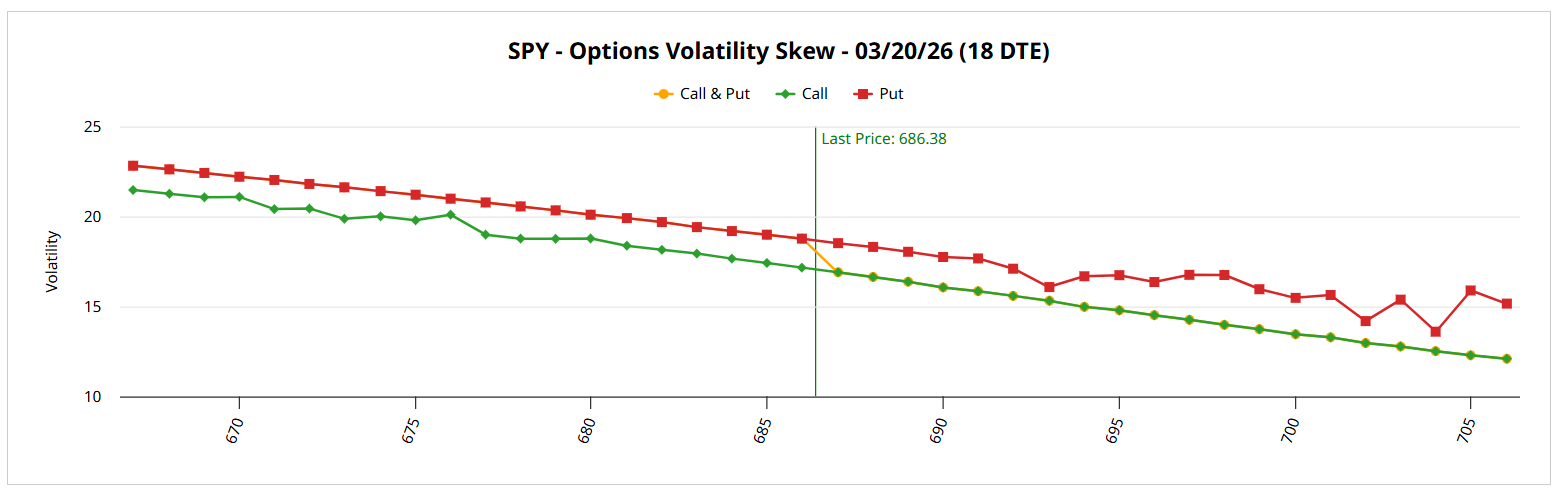
Basically, traders are paying more to protect against downside losses than they are hoping for upside gains. So, when we go back to the Expected Move calculator, we have a general understanding that — based on smart money positioning — sophisticated players are likely discounting the probability that WMT stock will hit the upper range of that dispersion.
However, it’s also clear that (at least for now) the smart money is still engaged regarding Walmart stock; sophisticated players aren’t abandoning ship. This gives us a rationale to explore a conservative debit-side trade.
Taking a Measured Bet on Walmart Stock
It may not be the most exciting idea but I’m intrigued by the 128/129 bull call spread expiring March 20. This trade requires a net debit of $61, which is the most that can be lost. Should WMT stock rise through the $129 strike at expiration, the maximum profit would come out to $39, a payout of nearly 64%.
Of course, this doesn’t sound like a great deal when there are so many other spreads that have much bigger payouts. However, this is also where you do need to factor in IV, with Barchart noting that volatility is low. If that’s the case, the chance of robust upside in the near term is going to be minimal.
Plus, with the smart money positioned more strongly for downside protection rather than upside convexity, the aforementioned spread seems reasonable. You’re not putting much money at risk for each spread and a 64% payout over the next few weeks isn’t something to scoff at.
On the date of publication, Josh Enomoto did not have (either directly or indirectly) positions in any of the securities mentioned in this article. All information and data in this article is solely for informational purposes. For more information please view the Barchart Disclosure Policy here.
/Microsoft%20headquarters%20By%20Peter.jpeg)
/Micron%20Technology%20Inc_%20logo%20on%20building-by%20vzphotos%20vis%20iStock.jpg)
/NVIDIA%20Corp%20logo%20outside%20building-by%20BING-JHEN_HONG%20via%20iStock.jpg)
/Amazon%20-%20Image%20by%20bluestork%20via%20Shutterstock.jpg)
/Robot%20arm%20industrial%20automation%20manufacturing%20by%20Eakrin%20via%20Adobe%20Stock.jpeg)