Chart of the Day
The information and opinions expressed below are based on my analysis of price behavior and chart activity
Sign Up to receive Walsh Trading’s 1st Half of 2026 Market Outlook First Half of 2026 Outlook for the Livestock and Grain markets.
Wednesday, February 25, 2026
If you like this article and would like to receive more information on the commodity markets from Walsh Trading, please use the link to join our daily email list -Click here
November Soybeans (Daily)
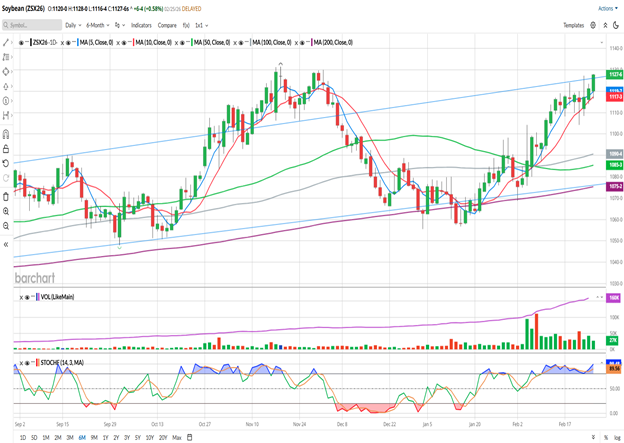
Today, November Soybeans closed at 11.27 ¾, up 6 ½ cents from Tuesday’s settlement. That’s just 1 ¼ cents from the November 17 high close of 11.29 that you see on the chart above. You might notice the blue trendlines drawn on the chart and today’s close posted a breakout above the upper trendline for the first time since early December. The market finished today right up against the high of the day, which was set about 5-6 minutes before the actual close, and looks strong.
The short-term moving averages on this chart (5 and 10 day, blue and red) have been in a bullish configuration since February 6th and are offering potential support levels at 11.20 and 11.17 ½, respectively. The grey and the green moving averages, the 100- and 50-day, are both well below the market at 10.90 ½ and 10.85 ½, respectively. As is the long-term average, the 200-day (purple) at 10.75 ¼. All of those averages are inclined and pointing toward higher prices. The 50- and 100-day average are still in a bearish configuration since they made a crossover also on February 6th. I do find it a bit odd that my short-term and medium-term averages made opposite crosses on the same day. The market hasn’t gotten weak, as the 50/100 crossover might have indicated, and it seems the bulls remain in control. The Stochastics (bottom sub-graph) are in an overbought condition, and have been from February 10th on. Without counting the days, it seems like this market has preferred overbought to oversold, over the 6-month timeframe displayed above.
Recent “bullish” news has been relatively sparse, in my opinion. The biggest news came from the USDA Ag Outlook Conference last week, when they projected an increase of 3.8 million acres planted to Soybeans here in the US, pegging this year’s acreage at 85.00 million. That wasn’t entirely unexpected, as last year’s record Corn harvest should see some acres dropped out of Corn production. This was just the USDA’s first, preliminary planting estimate of the year. The next will come with the March 31st Prospective Plantings report. That day will also see the release of the Quarterly Grain Stock numbers.
Bean traders have had an optimistic outlook for a while. And while I’ll be here for a big rally, should the market choose to cooperate, I’m not sure the bullishness is fully warranted.
Everyone wants to talk about China and the potential for additional purchases from them. However, they’ve been noticeably silent on that matter and the recent comments that I’ve seen from them, focused more on the “Phase One” purchases from Trump’s first term. The Supreme Court ruling from last Friday, regarding the tariffs that our President wants to implement, got virtually no reaction from the market. I’m far from a tariff expert, but rumblings from the White House suggest that the administration is actively seeking a work-around and I don’t think the global tariffs are going anywhere yet. Of course, we’ll all have to stay tuned in to find out how all that will work out.
Harvest of Soybeans in Brazil continues apace, with recent estimates at about 25% complete, as they work their way to another record crop. Estimates for total production are hovering around the 180 million metric ton mark, with the USDA’s number a touch higher still at 182 MMT. There has been some labor unrest, as protesters occupied an export facility, but apparently that was a 48-hour interruption related to govt plans to privatize a waterway that the facility sits on. Allegedly, the Brazilian govt gave in, and will leave the waterway as it is. Brazil’s Soybeans are priced lower than US Beans, with current values in Paranagua about $0.80 to $1.00 lower that US Beans in the Gulf. It’s hard for me to see where we might get more demand for US Beans, based on world exports.
February is also the month that is used to determine insurance prices in Corn and Beans for the upcoming crop year. If the month ended today (it doesn’t, there are still 2 more trading days) this year’s Soybean insurance price would be at $11.04 ¼, which is roughly a 50-cent improvement over 2025’s $10.52 ½.
To recap a bit, the chart looks strong, but a huge Brazilian crop and uncertainty over China/tariffs may offer some fodder for the bears.
For the aggressive and well-margined traders out there, I would suggest patience if you’re looking for a bullish entry point. Yes, the market looks strong and today’s close was bullish. Until the market closes above the six-month high of $11.31 1/2 , I still view that level as resistance. The 5- and 10-day moving averages should offer potential support, but with the HUGE Brazilian crop being harvested, I could easily see the market trading back down to the 50- or 100-day averages, which are both below $11.00. I could be wrong, we could be off to the races, but history tells me that a turn lower could be on the near horizon.
Soybean producers may do well to consider hedging a portion of their intended production at current price levels. There’s still the whole US crop season ahead of us, so I wouldn’t want to get too aggressive just yet. Perhaps no more than 20% of your expected production levels. A lot can happen between now and harvest. My suggestion is to consider November Put Spreads. Today, the 11.00/10.50 Put Spread settled at 20 cents, or $1,000 out-of-pocket per spread, before your commissions/fees. The delta on the 11.00 Puts is currently around 0.42, so you might need 3 of those spreads to adequately protect 5,000 bushels. Place a GTC order to take profit on that Spread at 2x (40 cents) what you paid for it and see if would make sense to re-up with another Put position or potentially establish short futures hedges at that time. I wouldn’t necessarily recommend a protective stop on the Put Spread, rather set an alert at 10 cents, or ½ of what you’ve paid for the position. Depending on when that happens, and where the market price is at that time, it could make sense to exit the Put Spreads altogether, or it could make sense to add more of those spreads and get additional downside protection at a less expensive price point. I would also suggest that you look at the weekly chart below. If the pattern over the past year continues, this could be a good year for a selective and dynamic hedging approach. What I mean by that is selling the market at/near upper end of the trading channel and then buying those hedges back when prices revisit the lower end.
(Weekly)
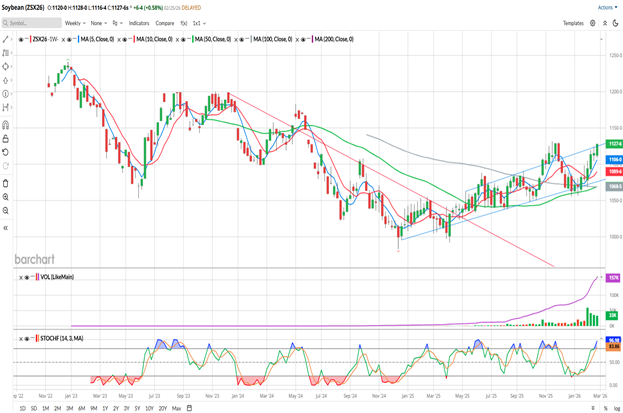
The weekly chart of November Soybeans just above appears to show a market that has been in a choppy, uptrending channel since posting the contract low in December 2024. It certainly hasn’t been a straight move higher, and barring an unforeseen event, I would expect that pattern to continue. You might notice the blue trendlines that I’ve drawn on the chart above. We’re currently seeing the market break out (or attempt to, anyway) above the high trendline. Prices have gone above that trendline, most recently this past November, on more than one occasion over the past year and have always returned to the lower trendline. Today those levels are near 11.25 on the upper end and near 10.75 on the lower end. If you were to draw a line across the highs in June-November, that would be up near 11.60 this week. I don’t typically use those spike highs/lows for trendlines (that’s why it’s not pictured), but if you do, now you know where that upper one could be.
The technical indicators that I watch on the weekly chart all seem bullish, at the moment. The 5- and 10-week moving averages made a bullish cross at the beginning of February and are currently at 11.06 and 10.89 ¾ offering potential support. The 50- and 100-week averages are making a bullish crossover this week and are both just under 10.70. Stochastics are just barely getting into an overbought condition. Since the market trend turned up and the downtrend was broken (red trendline) in February of last year, the Soybean market seems much more willing to be overbought than oversold. Neither condition has stayed around for very long over the past year, but that’s a welcome improvement over the extended oversold conditions that were the feature of 2024.
You can view Barchart’s Seasonal Data for November Soybeans here. According to their data, Beans traded lower in March 56% of the time over the past 15 years and then higher in April 56% of the time, as well. The seasonal charts that I watch, suggest a lower move into the first week of April. I also think that corresponds to the approximate timing of the beginning of planting season. After that we may see the market rally a bit due to the usual weather uncertainties (too cold, too hot, too wet, too dry) into early-mid June.
Sign Up to receive Walsh Trading’s 1st Half of 2026 Market Outlook First Half of 2026 Outlook for the Livestock and Grain markets.
If you like what you’ve read here and would like to see more like this from Walsh Trading, please Click here and sign up for our daily futures market email.
Jefferson Fosse Walsh Trading
Direct 312 957 8248 Toll Free 800 556 9411
jfosse@walshtrading.com www.walshtrading.com
Walsh Trading, Inc. is registered as a Guaranteed Introducing Broker with the Commodity Futures Trading Commission and an NFA Member.
Futures and options trading involves substantial risk and is not suitable for all investors. Therefore, individuals should carefully consider their financial condition in deciding whether to trade. Option traders should be aware that the exercise of a long option will result in a futures position. The valuation of futures and options may fluctuate, and as a result, clients may lose more than their original investment. The information contained on this site is the opinion of the writer or was obtained from sources cited within the commentary. The impact on market prices due to seasonal or market cycles and current news events may already be reflected in market prices. PAST PERFORMANCE IS NOT NECESSARILY INDICATIVE OF FUTURE RESULTS. All information, communications, publications, and reports, including this specific material, used and distributed by Walsh Trading, Inc. (“WTI”) shall be construed as a solicitation for entering into a derivatives transaction. WTI does not distribute research reports, employ research analysts, or maintain a research department as defined in CFTC Regulation 1.71.


/Apple%20Inc%20logo%20on%20Apple%20store-by%20PhillDanze%20via%20iStock.jpg)
/Visa%20Inc%20gold%20card-by%20hatchpong%20via%20iStock.jpg)