
Financial services company Capital One (NYSE:COF) reported Q4 CY2025 results beating Wall Street’s revenue expectations, with sales up 52.9% year on year to $15.58 billion. Its non-GAAP profit of $3.86 per share was 6.8% below analysts’ consensus estimates.
Is now the time to buy Capital One? Find out by accessing our full research report, it’s free.
Capital One (COF) Q4 CY2025 Highlights:
- Net Interest Margin: 8.3% vs analyst estimates of 8.3% (in line)
- Revenue: $15.58 billion vs analyst estimates of $15.49 billion (52.9% year-on-year growth, 0.6% beat)
- Efficiency Ratio: 60% vs analyst estimates of 52.5% (747.7 basis point miss)
- Adjusted EPS: $3.86 vs analyst expectations of $4.14 (6.8% miss)
- Tangible Book Value per Share: $107.72 vs analyst estimates of $106.76 (1% year-on-year growth, 0.9% beat)
- Market Capitalization: $146.9 billion
Company Overview
Starting as a credit card company in 1988 before expanding into a full-service bank, Capital One (NYSE:COF) is a financial services company that offers credit cards, auto loans, banking services, and commercial lending to consumers and businesses.
Revenue Growth
Examining a company’s long-term performance can provide clues about its quality. Any business can put up a good quarter or two, but the best consistently grow over the long haul. Luckily, Capital One’s revenue grew at a solid 13.5% compounded annual growth rate over the last five years. Its growth beat the average financials company and shows its offerings resonate with customers, a helpful starting point for our analysis.
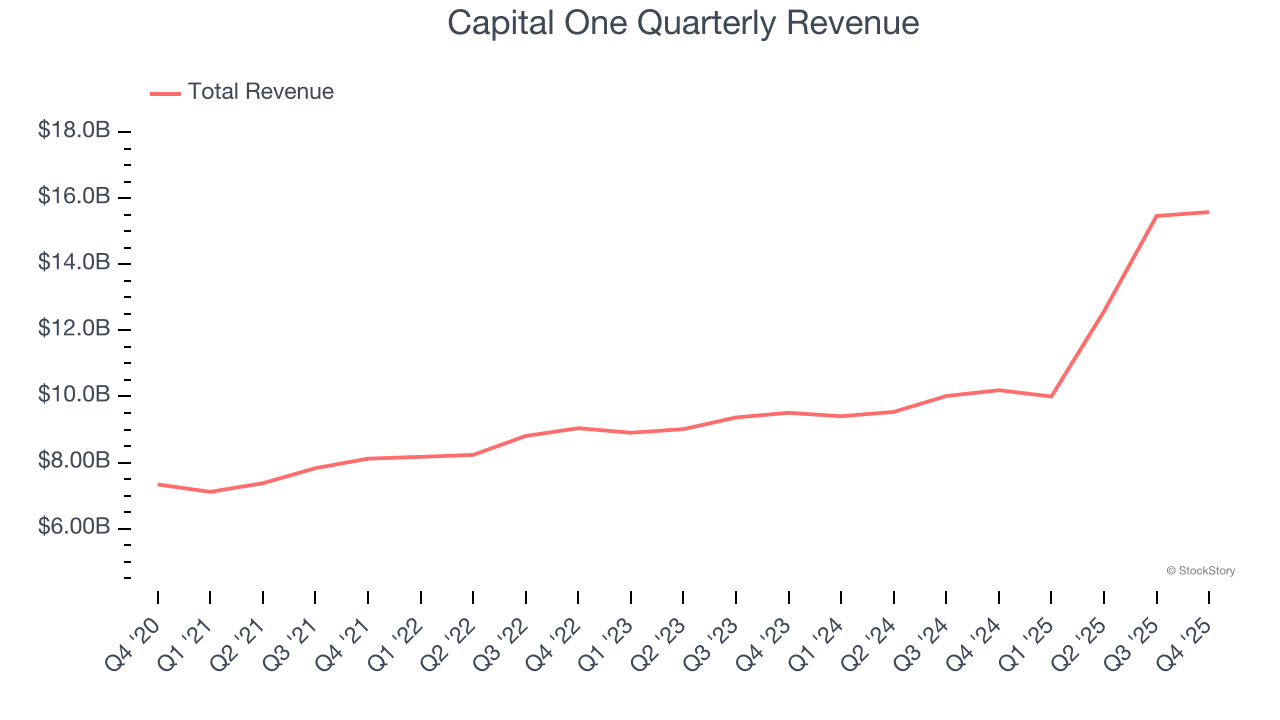
We at StockStory place the most emphasis on long-term growth, but within financials, a half-decade historical view may miss recent interest rate changes, market returns, and industry trends. Capital One’s annualized revenue growth of 20.7% over the last two years is above its five-year trend, suggesting its demand was strong and recently accelerated. 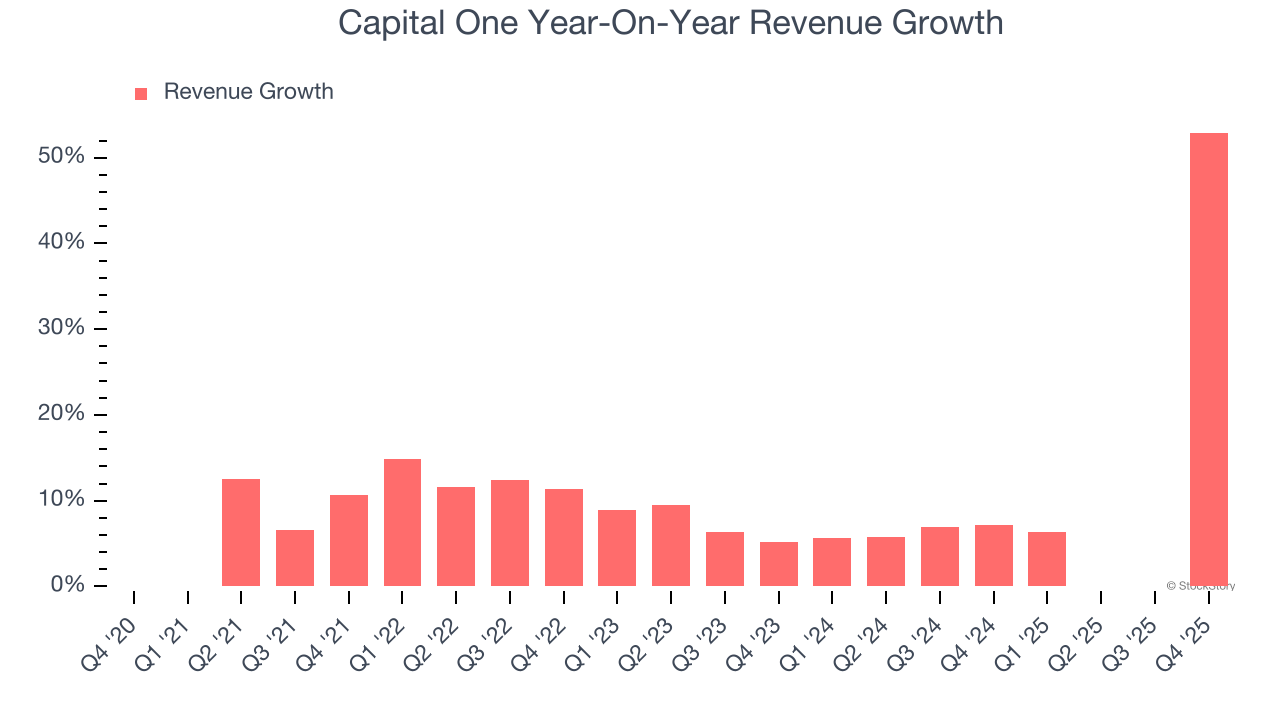 Note: Quarters not shown were determined to be outliers, impacted by outsized investment gains/losses that are not indicative of the recurring fundamentals of the business.
This quarter, Capital One reported magnificent year-on-year revenue growth of 52.9%, and its $15.58 billion of revenue beat Wall Street’s estimates by 0.6%.
While Wall Street chases Nvidia at all-time highs, an under-the-radar semiconductor supplier is dominating a critical AI component these giants can’t build without. Click here to access our free report one of our favorites growth stories.
Tangible Book Value Per Share (TBVPS)
Financial institutions with multiple business lines manage complex balance sheets that span various financial activities. Market valuations reflect this operational complexity, prioritizing balance sheet strength and sustainable book value growth across all business segments.
Because of this, tangible book value per share (TBVPS) emerges as the critical performance benchmark for the sector. This metric captures real, liquid net worth per share that reflects the institution’s overall financial health across all business lines. Other (and more commonly known) per-share metrics like EPS can sometimes be murky due to the complexity of multiple business lines, M&A activity, or accounting rules that vary across different financial services segments.
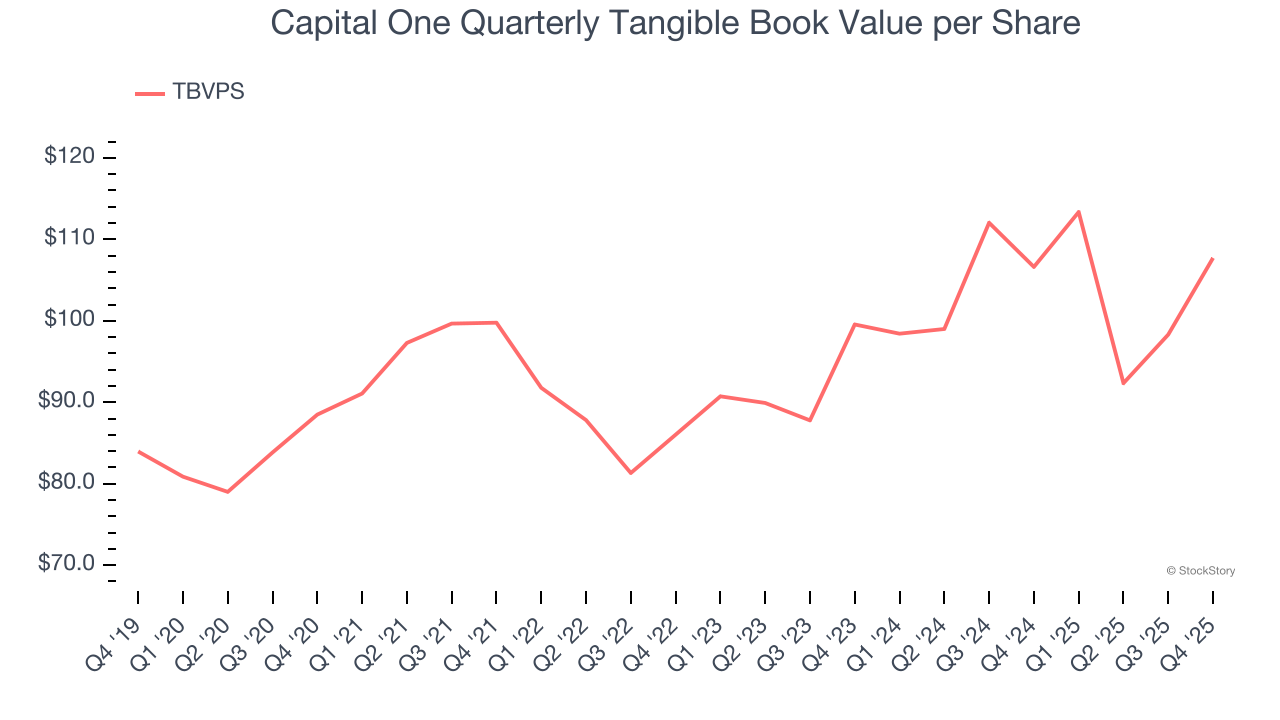
Capital One’s TBVPS grew at a sluggish 4% annual clip over the last five years. The last two years show a similar trajectory as TBVPS grew by 4% annually from $99.55 to $107.72 per share.

Tangible Book Value Per Share (TBVPS)
Financial firms generate earnings through diverse intermediation activities, making them fundamentally balance sheet-driven enterprises. Investors focus on balance sheet quality and consistent book value compounding when evaluating these multifaceted financial institutions.
This explains why tangible book value per share (TBVPS) is a premier metric for the sector. TBVPS provides concrete per-share net worth that investors can trust when evaluating companies with complex, multi-faceted business models. EPS can become murky due to the complexity of multiple revenue streams, acquisition impacts, or accounting flexibility across different financial services, and book value resists financial engineering manipulation.
Capital One’s TBVPS grew at a sluggish 4% annual clip over the last five years. The last two years show a similar trajectory as TBVPS grew by 4% annually from $99.55 to $107.72 per share.
Key Takeaways from Capital One’s Q4 Results
We were impressed by how significantly Capital One blew past analysts’ efficiency ratio expectations this quarter. On the other hand, its EPS missed and its net interest margin was in line with Wall Street’s estimates. Overall, this quarter could have been better. The stock traded down 3.8% to $225.39 immediately following the results.
Capital One’s earnings report left more to be desired. Let’s look forward to see if this quarter has created an opportunity to buy the stock. When making that decision, it’s important to consider its valuation, business qualities, as well as what has happened in the latest quarter. We cover that in our actionable full research report which you can read here (it’s free).


/AI%20(artificial%20intelligence)/AI%20software%20engineering%20by%20Tapati%20Rinchumrus%20via%20Shutterstock.jpg)
/Broadcom%20Inc%20logo%20on%20phone%20and%20site-by%20Majahid%20Mottakin%20via%20Shutterstock.jpg)

/Micron%20Technology%20Inc_%20logo%20on%20building-by%20vzphotos%20vis%20iStock.jpg)