
Bitcoin Analysis
The chart is key to this analysis.
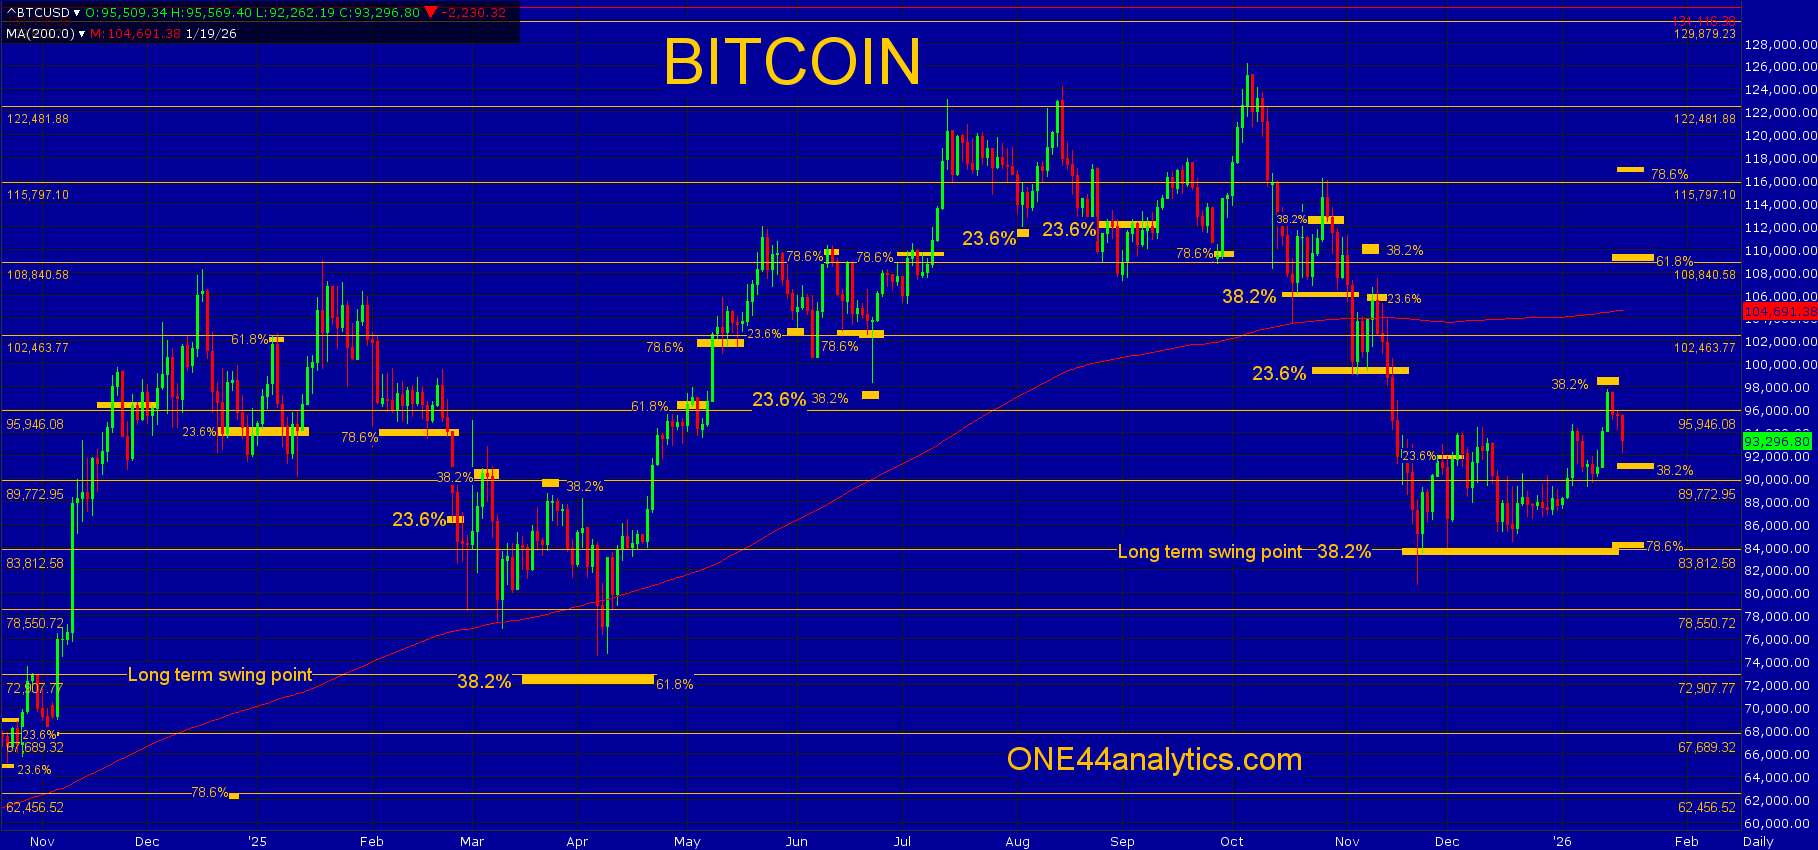
There are two methods we use at ONE44 to find support and resistance in the markets.
The first are major Gann squares, these are the yellow horizontal lines on the chart.
The second is Fibonacci retracements.
Here is the short version of this week's update using these methods.
Bitcoin
From last week,
Use 83,312 as the swing point for the week.
The short term target is 38.2% back to the ATH at 98,200, the longer term ....
The high for the week fell just short of 38.2% at 98.200 and this will be the key level for the week.
.
Use 98,200 as the swing point for the week.
Above it, the short term target is the 102,463 major Gann square, The long term target is 108,840, this is a major Gann square and 61.8% back to the ATH.
Below it, the short term target is 38.2% back to the 11/21/25 low at 91.280, holding this is a strong sign especially after holding the long term swing point below and a new high can quickly follow. The long term target is 78.6% of the same move at 84,500, there is also the long term swing point at 83,812 for added support.
You can sign up here for free Gold, Crude Oil, SP500 & Bitcoin Updates.
ONE44 Analytics where the analysis is concise and to the point
Our goal is to not only give you actionable information, but to help you understand why we think this is happening based on pure price analysis with Fibonacci retracements, that we believe are the underlying structure of all markets and Gann squares.
If you like this type of analysis and trade the Grain/Livestock futures you can become a Premium Member.
You can also follow us on YouTube for more examples of how to use the Fibonacci retracements with the ONE44 rules and guidelines.
FULL RISK DISCLOSURE: Futures trading contains substantial risk and is not for every investor. An investor could potentially lose all or more than the initial investment. Commission Rule 4.41(b)(1)(I) hypothetical or simulated performance results have certain inherent limitations. Unlike an actual performance record, simulated results do not represent actual trading. Also, since the trades have not actually been executed, the results may have under- or over-compensated for the impact, if any, of certain market factors, such as lack of liquidity. Simulated trading programs in general are also subject to the fact that they are designed with the benefit of hindsight. No representation is being made that any account will or is likely to achieve profits or losses similar to those shown. Past performance is not necessarily indicative of future results.


/Quantum%20Computing/A%20concept%20image%20with%20a%20brain%20on%20top%20of%20a%20blue%20circuit%20board_%20Image%20by%20Gorodenkoff%20via%20Shutterstock_.jpg)

