
Five Charts to Put 2025/26 U.S. Corn Demand in Perspective
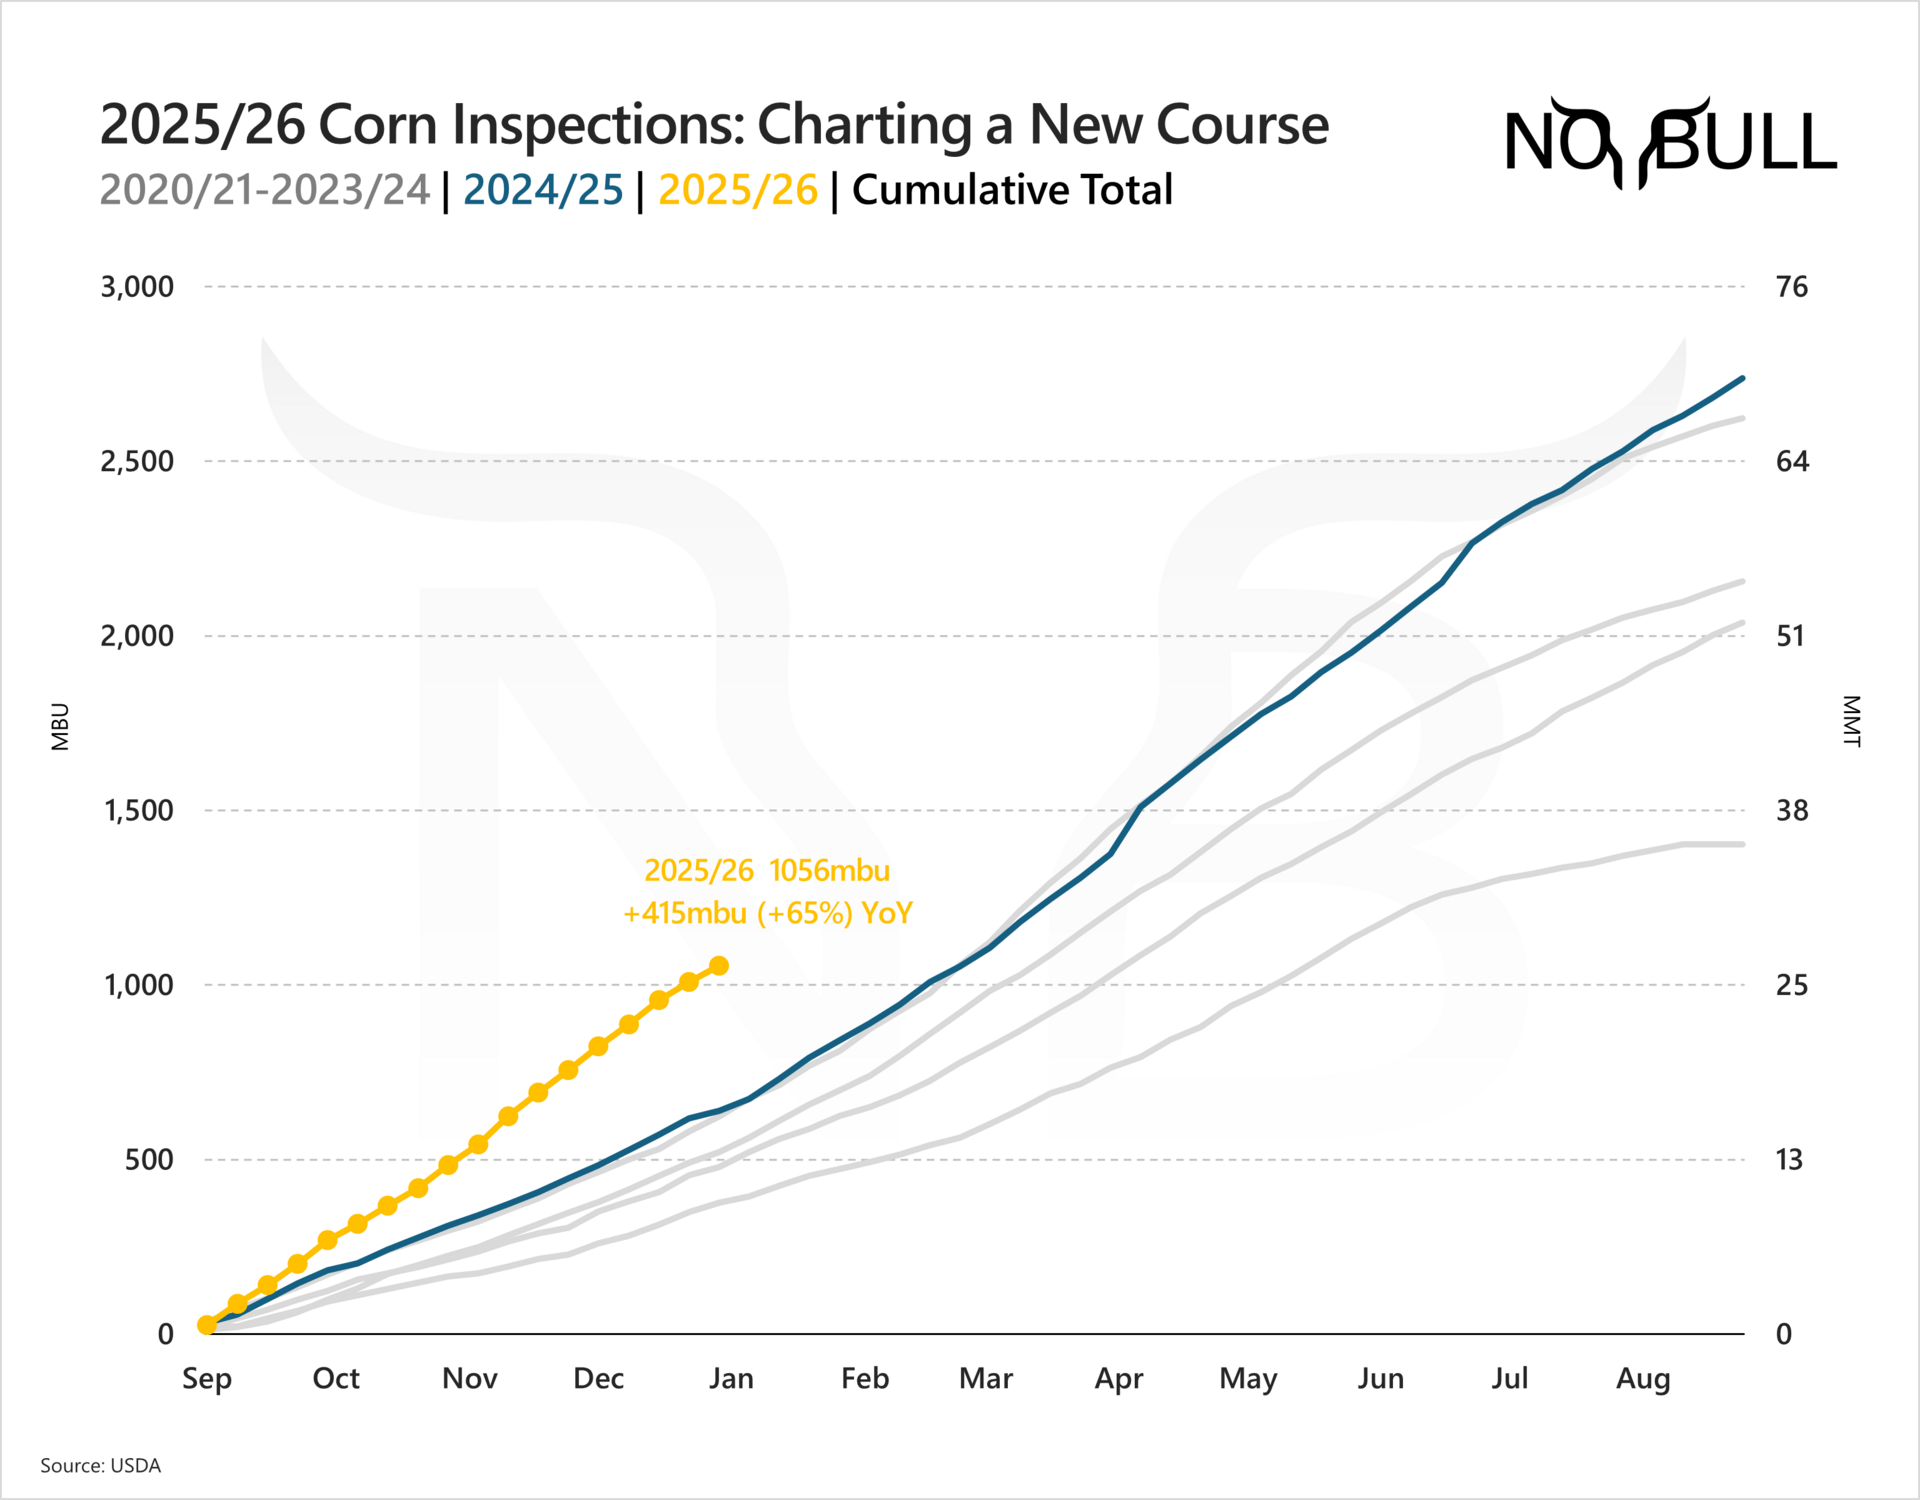
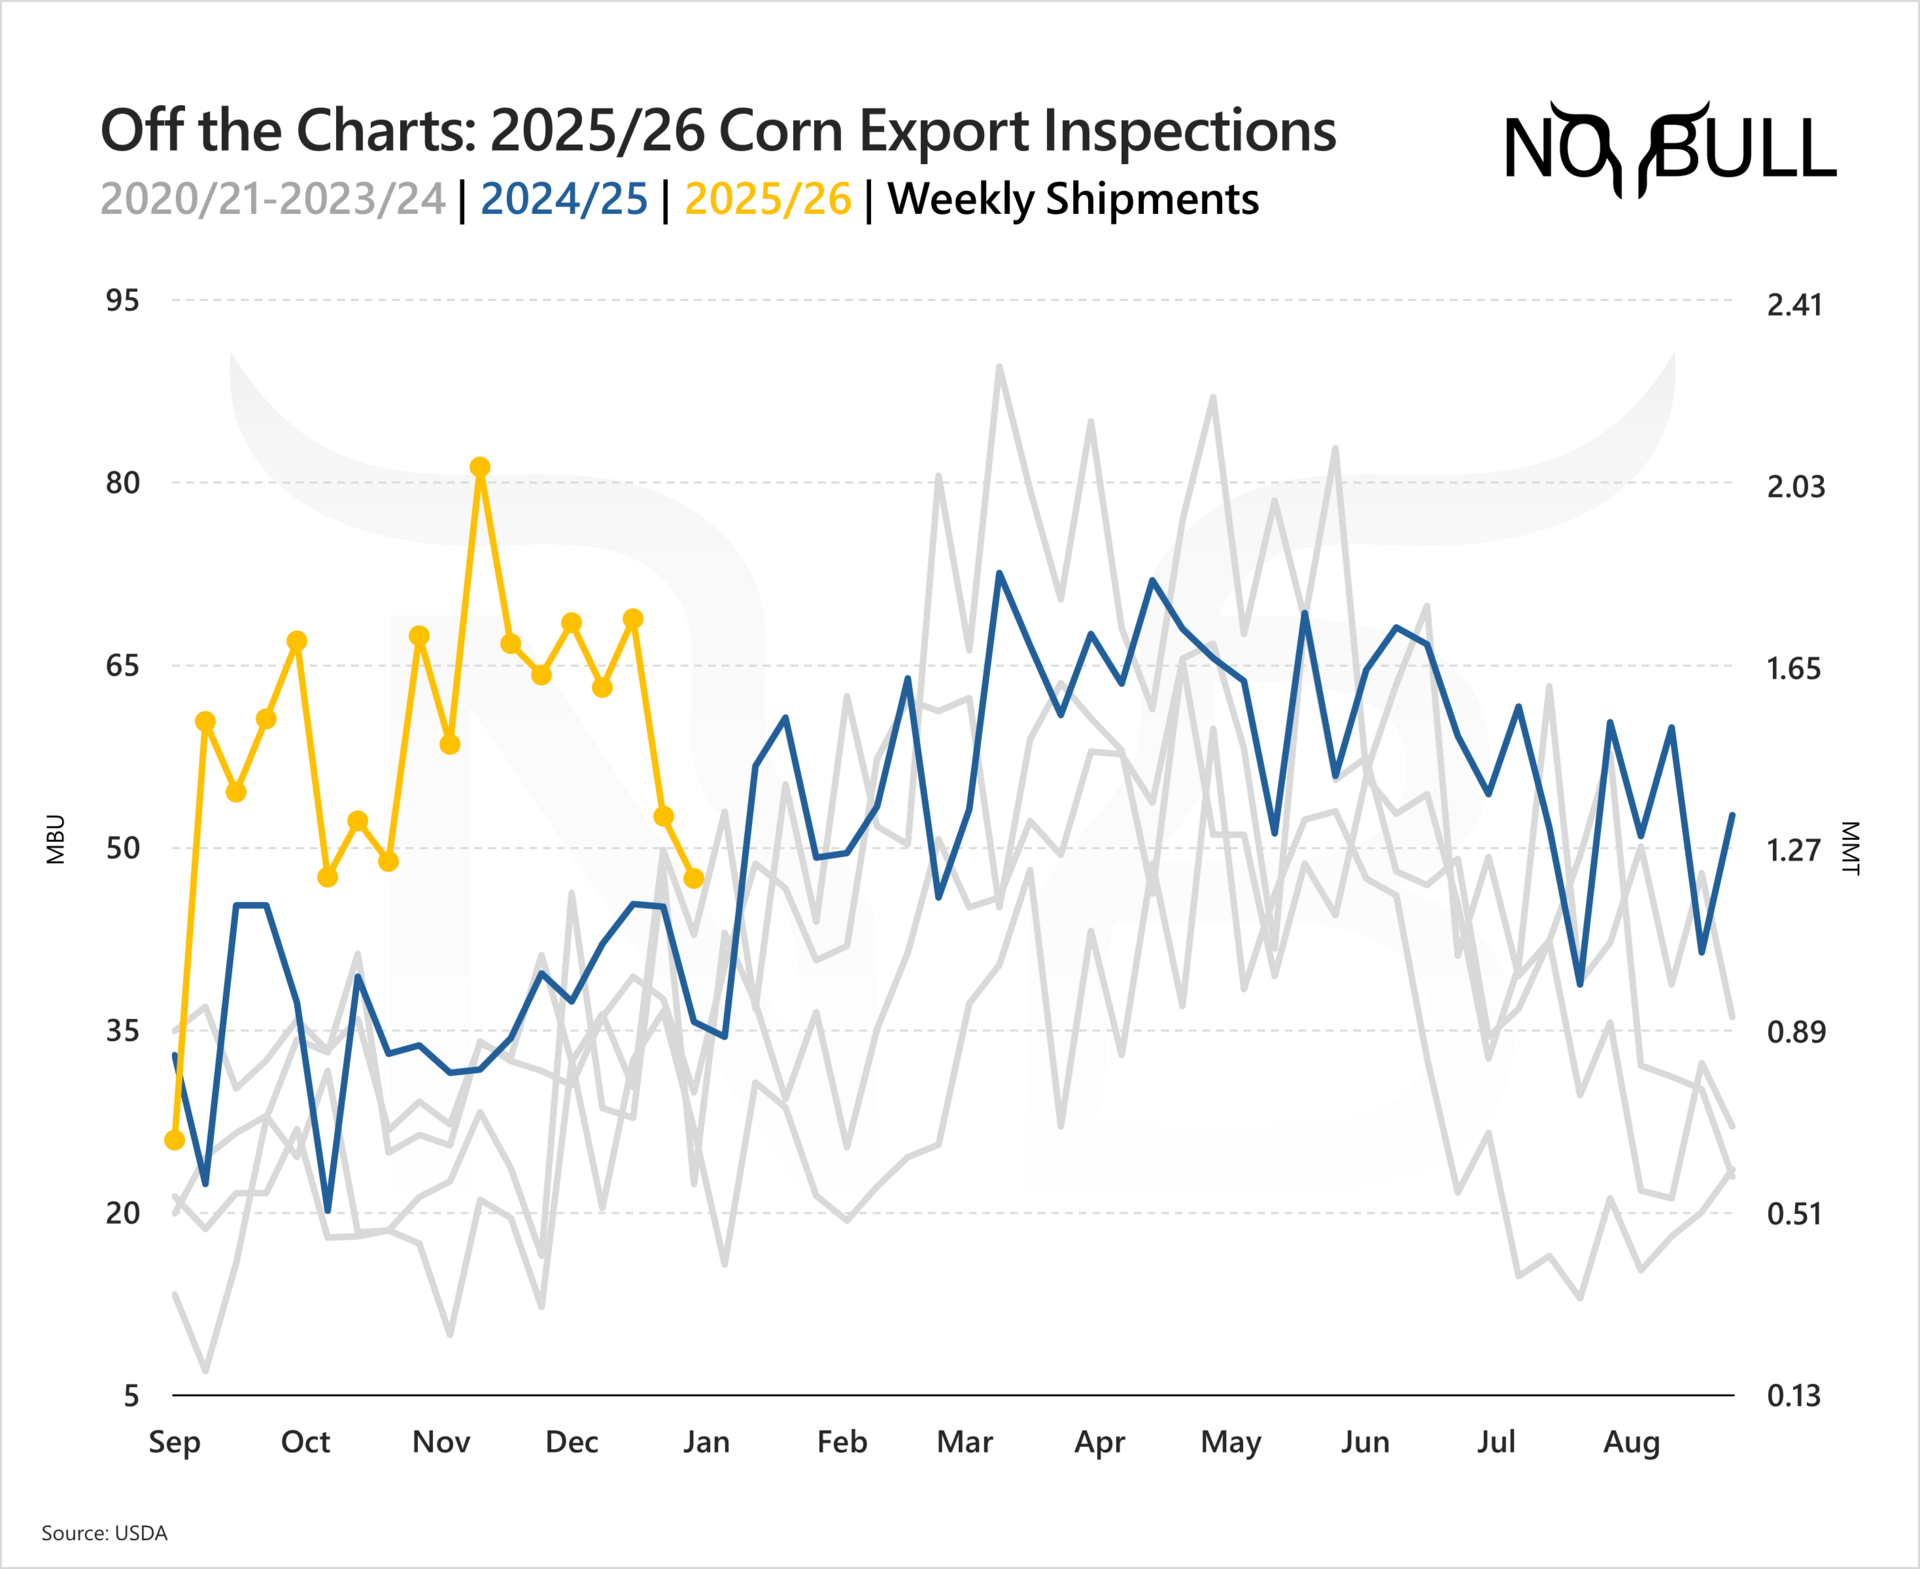
5 | Off the Charts
U.S. corn export inspections remain off the charts in 2025/26, with a record 1,056 mbu (26.8 mmt) shipped in the first four months of the marketing year.
4 | Time to Shine
The surge has been driven by the PNW, where shipments continue to shatter records as U.S. corn remains highly competitive into Asia. Sales to Japan are up 45% year over year, while South Korea’s commitments have jumped an incredible 260% from this point in 2024/25.
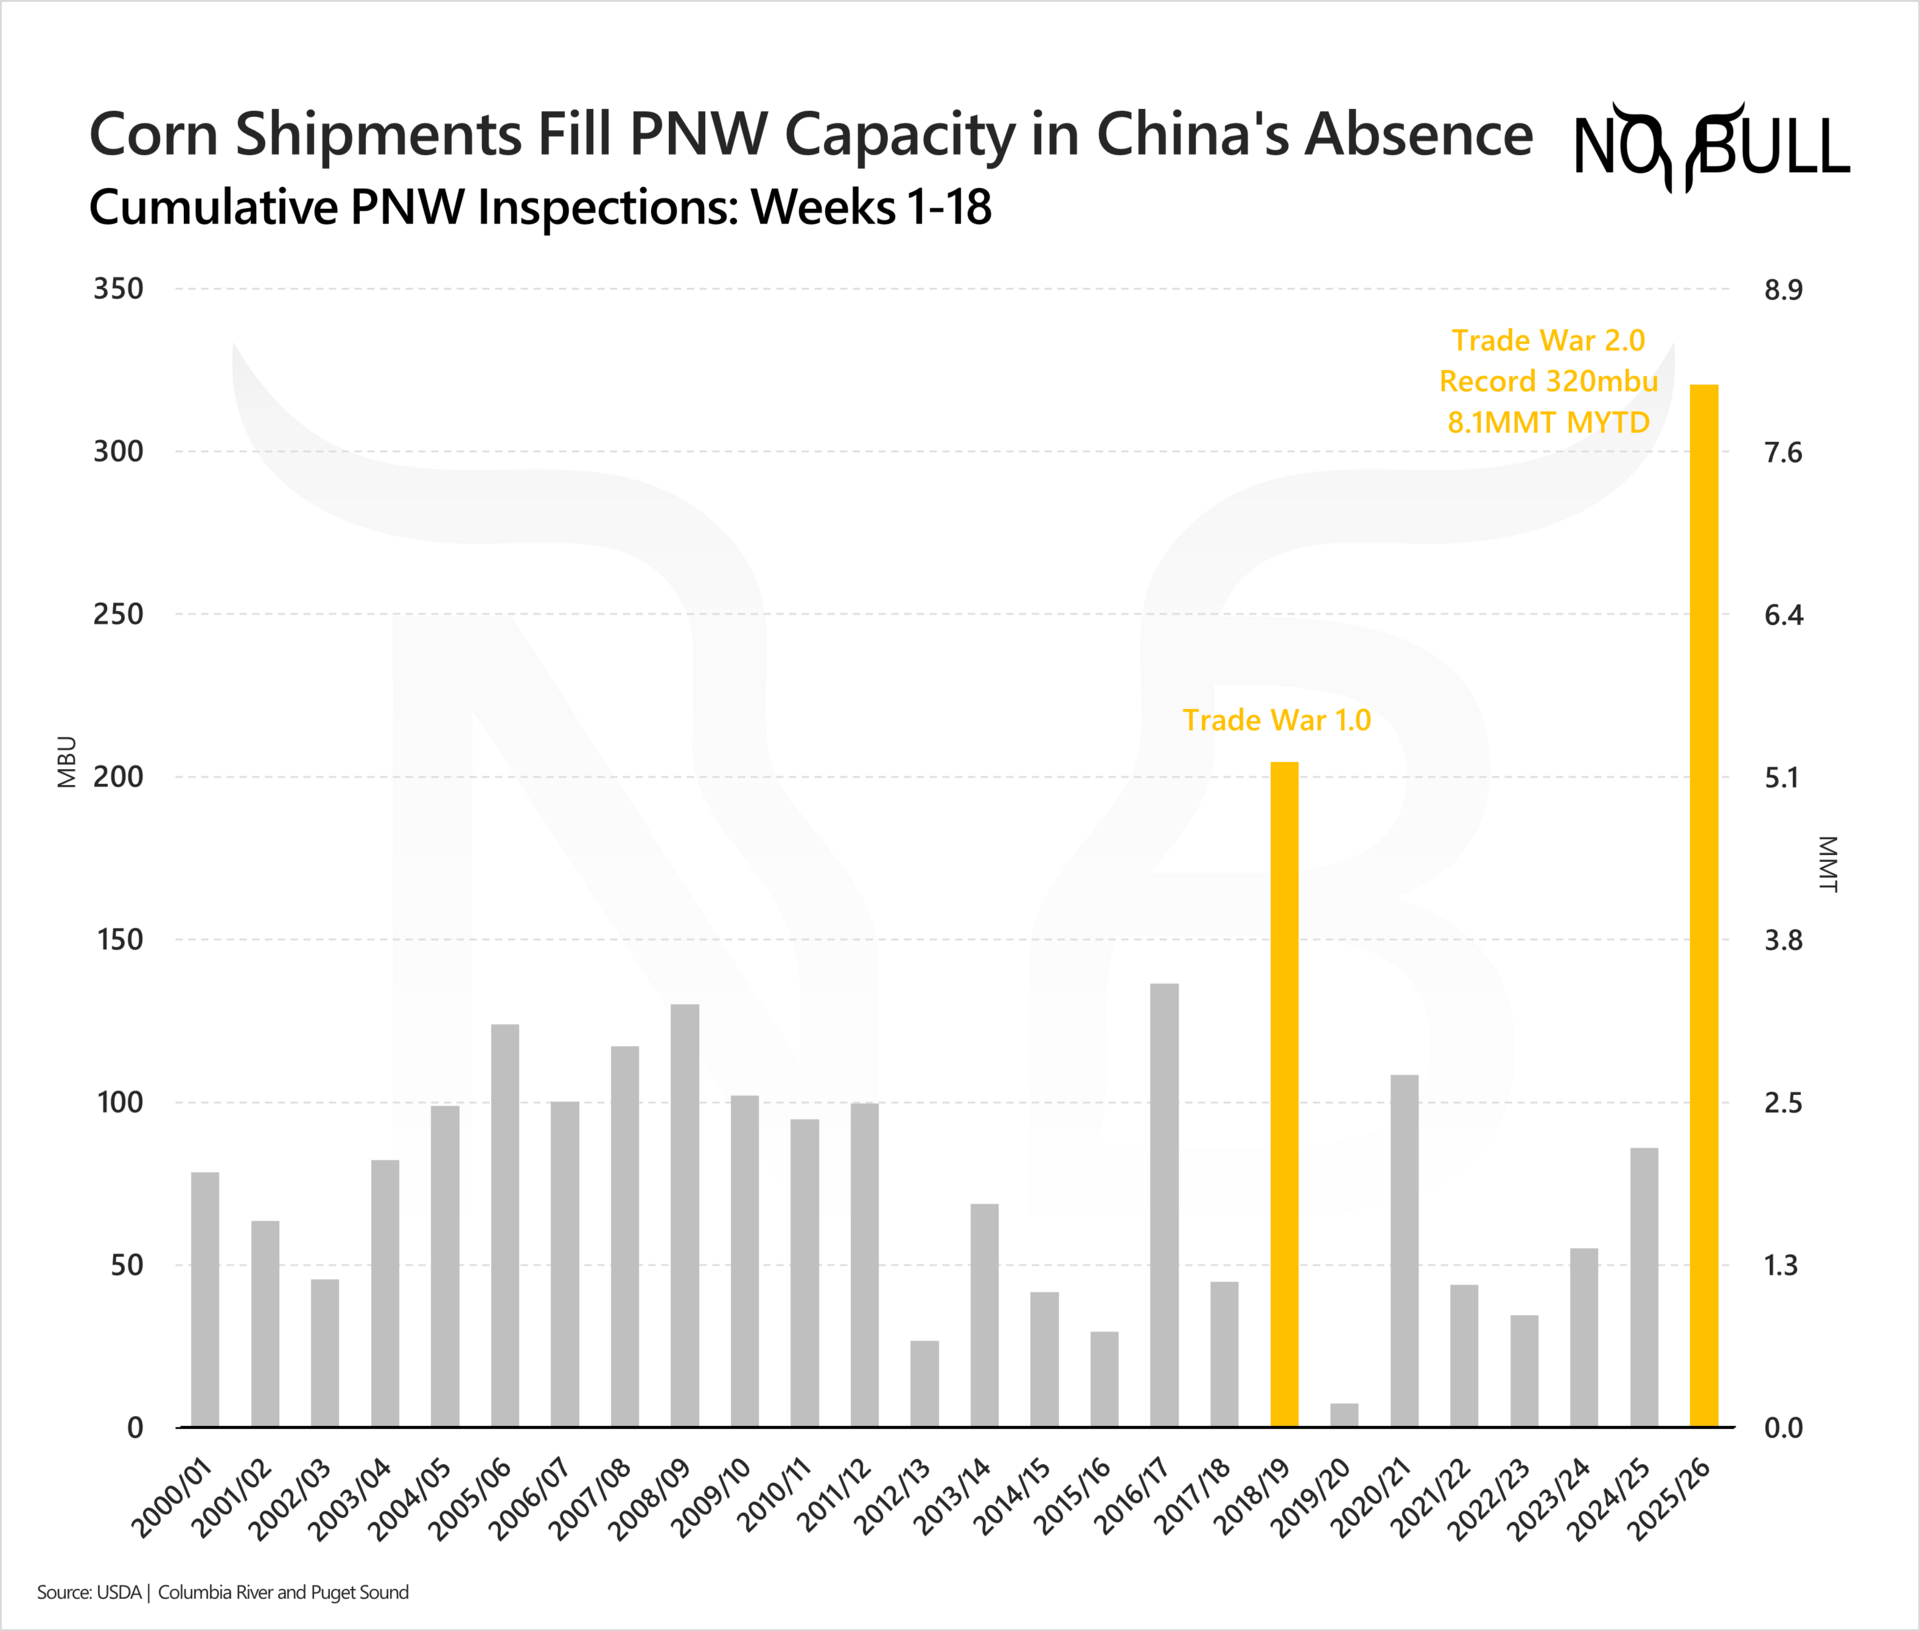
3 | Front-loaded
Typically, U.S. corn shipments build into the winter and peak in the spring — after the bulk of the U.S. soybean export program is complete.
This year, that window was pulled forward, as exporters filled PNW capacity left open by China’s absence from the soybean market during the first three months of the marketing year.
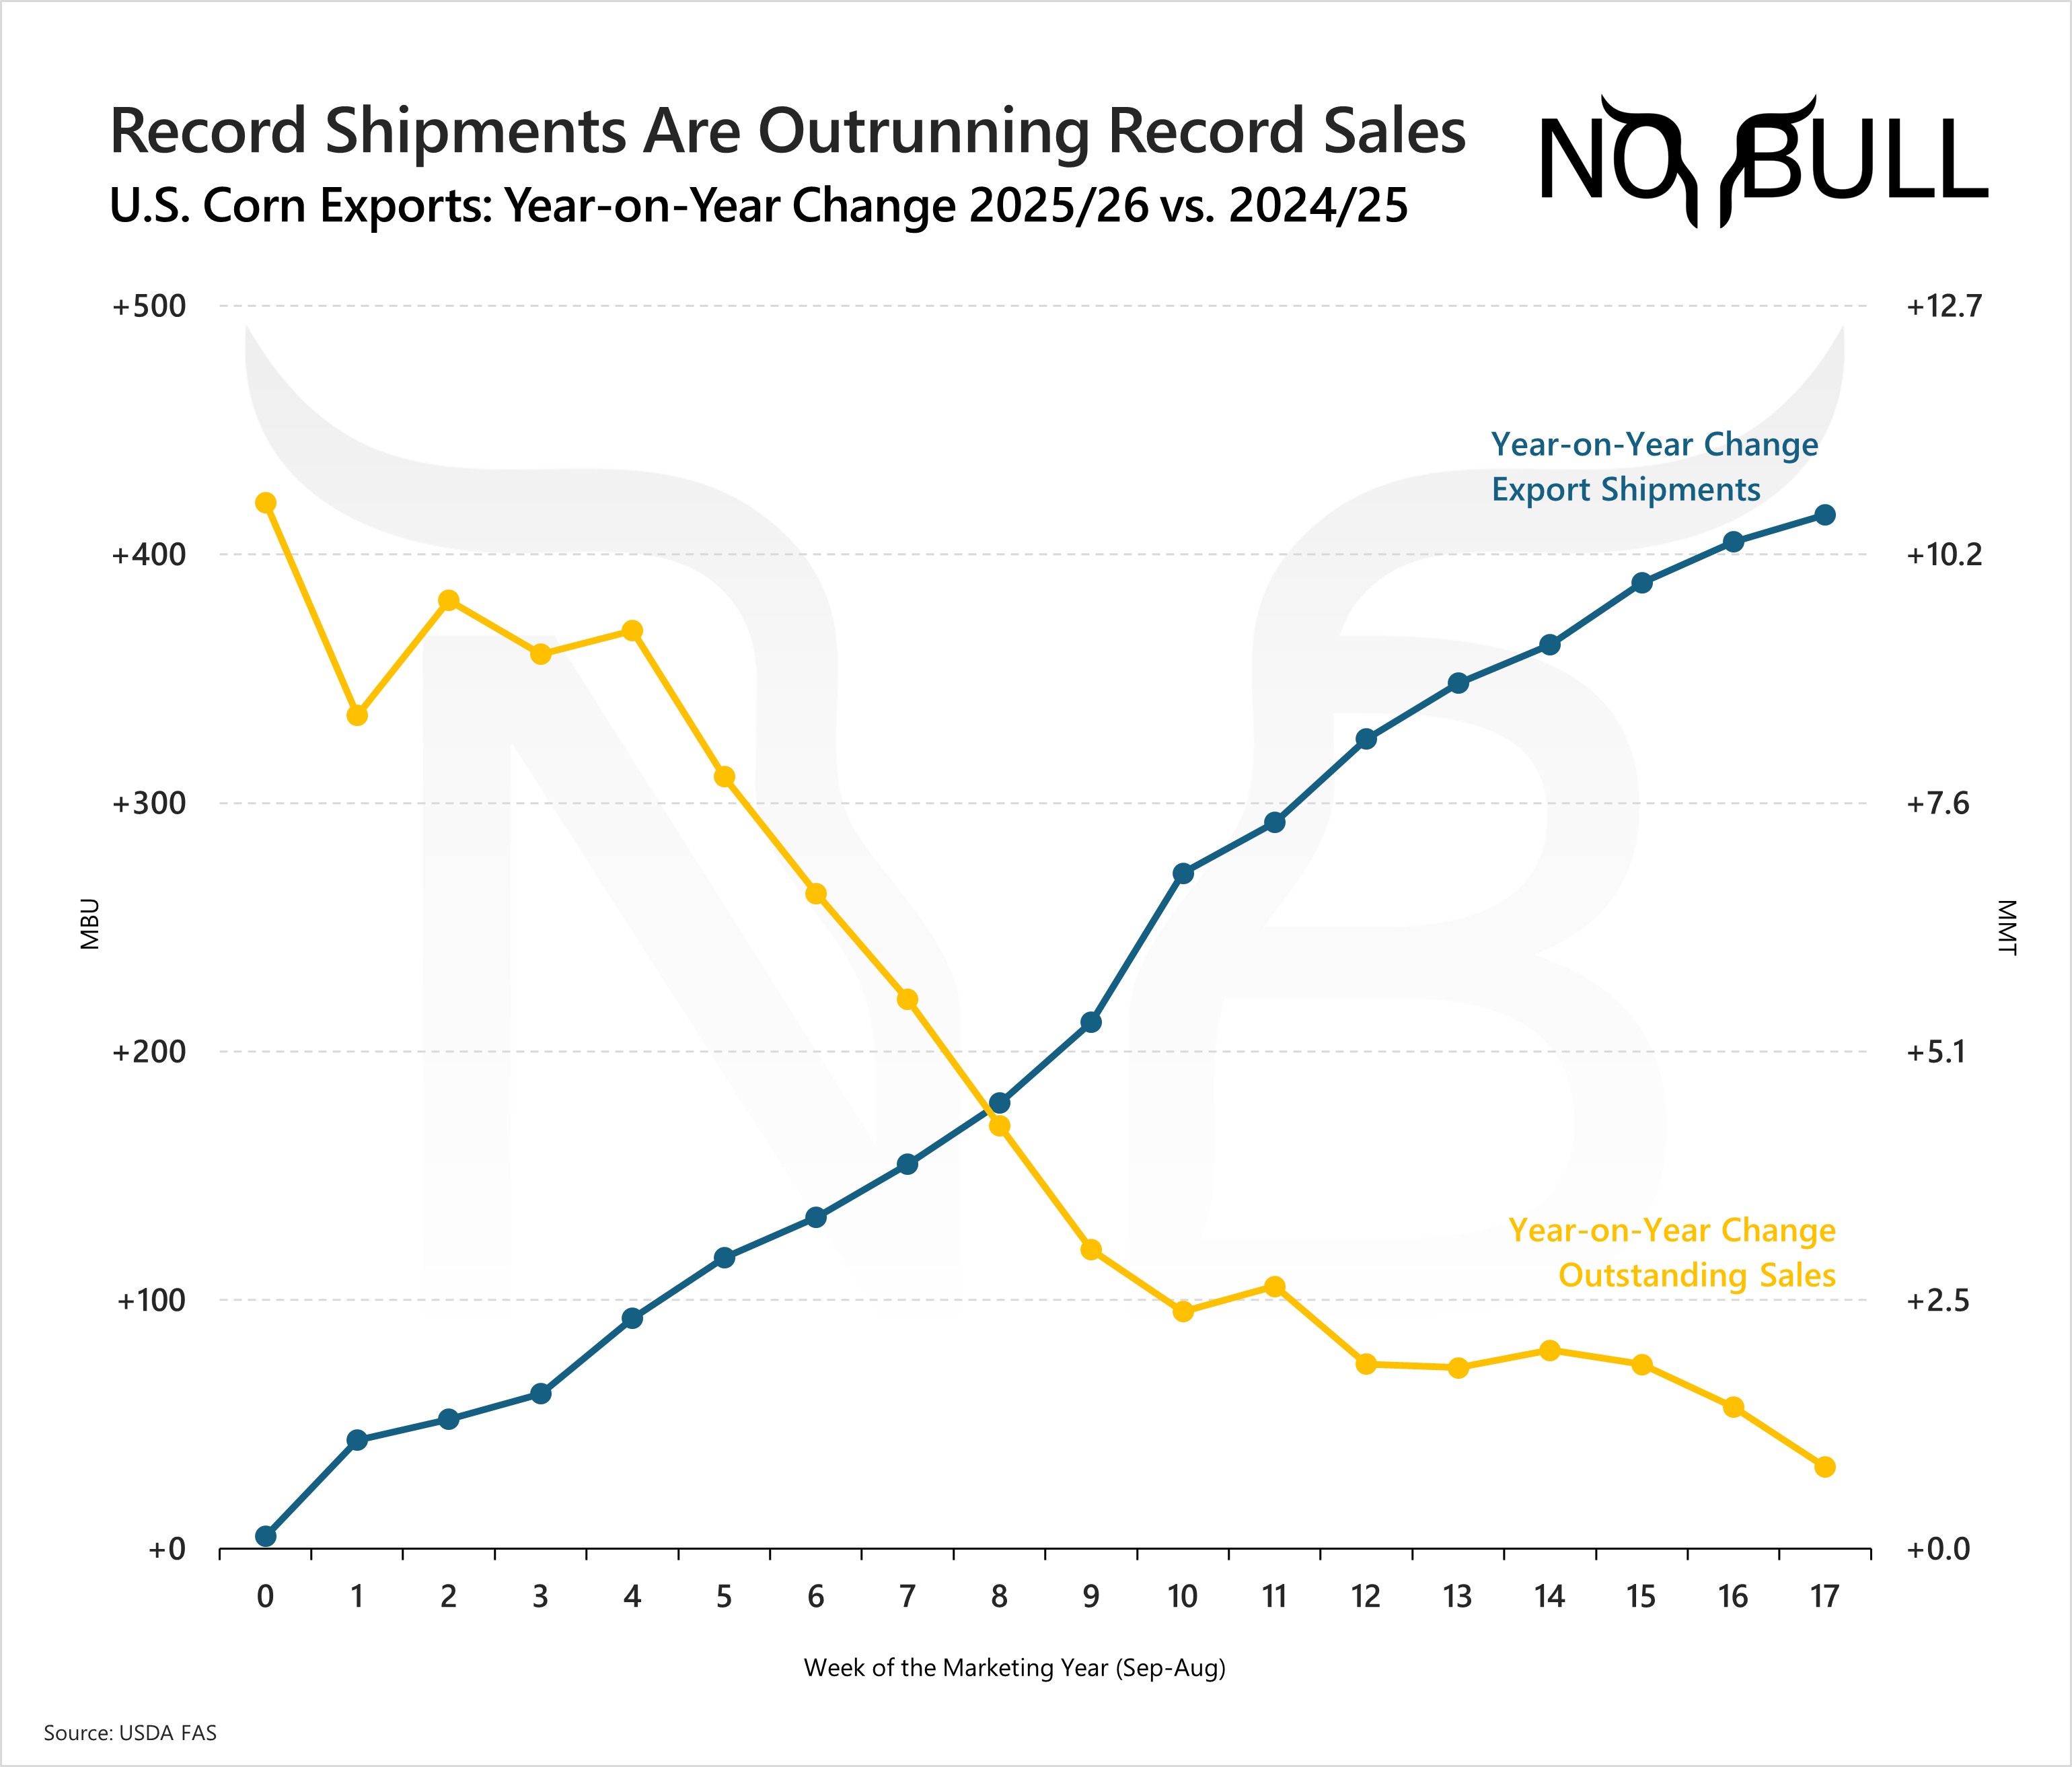
2 | A slowdown ahead?
The question now is whether this pace can be sustained as we move deeper into what is traditionally the heart of the U.S. corn shipment window.
While total export commitments topping 2.0 billion bushels in the week ending January 1 — up 460 mbu year over year — shipments are outpacing new sales, a dynamic that suggests the current export pace is likely to cool in the weeks ahead.
Even so, with tight exporter stocks elsewhere the U.S. is likely to remain the dominant supplier in the global corn market until Ukraine can find its footing or Argentine new crop becomes available later this spring.
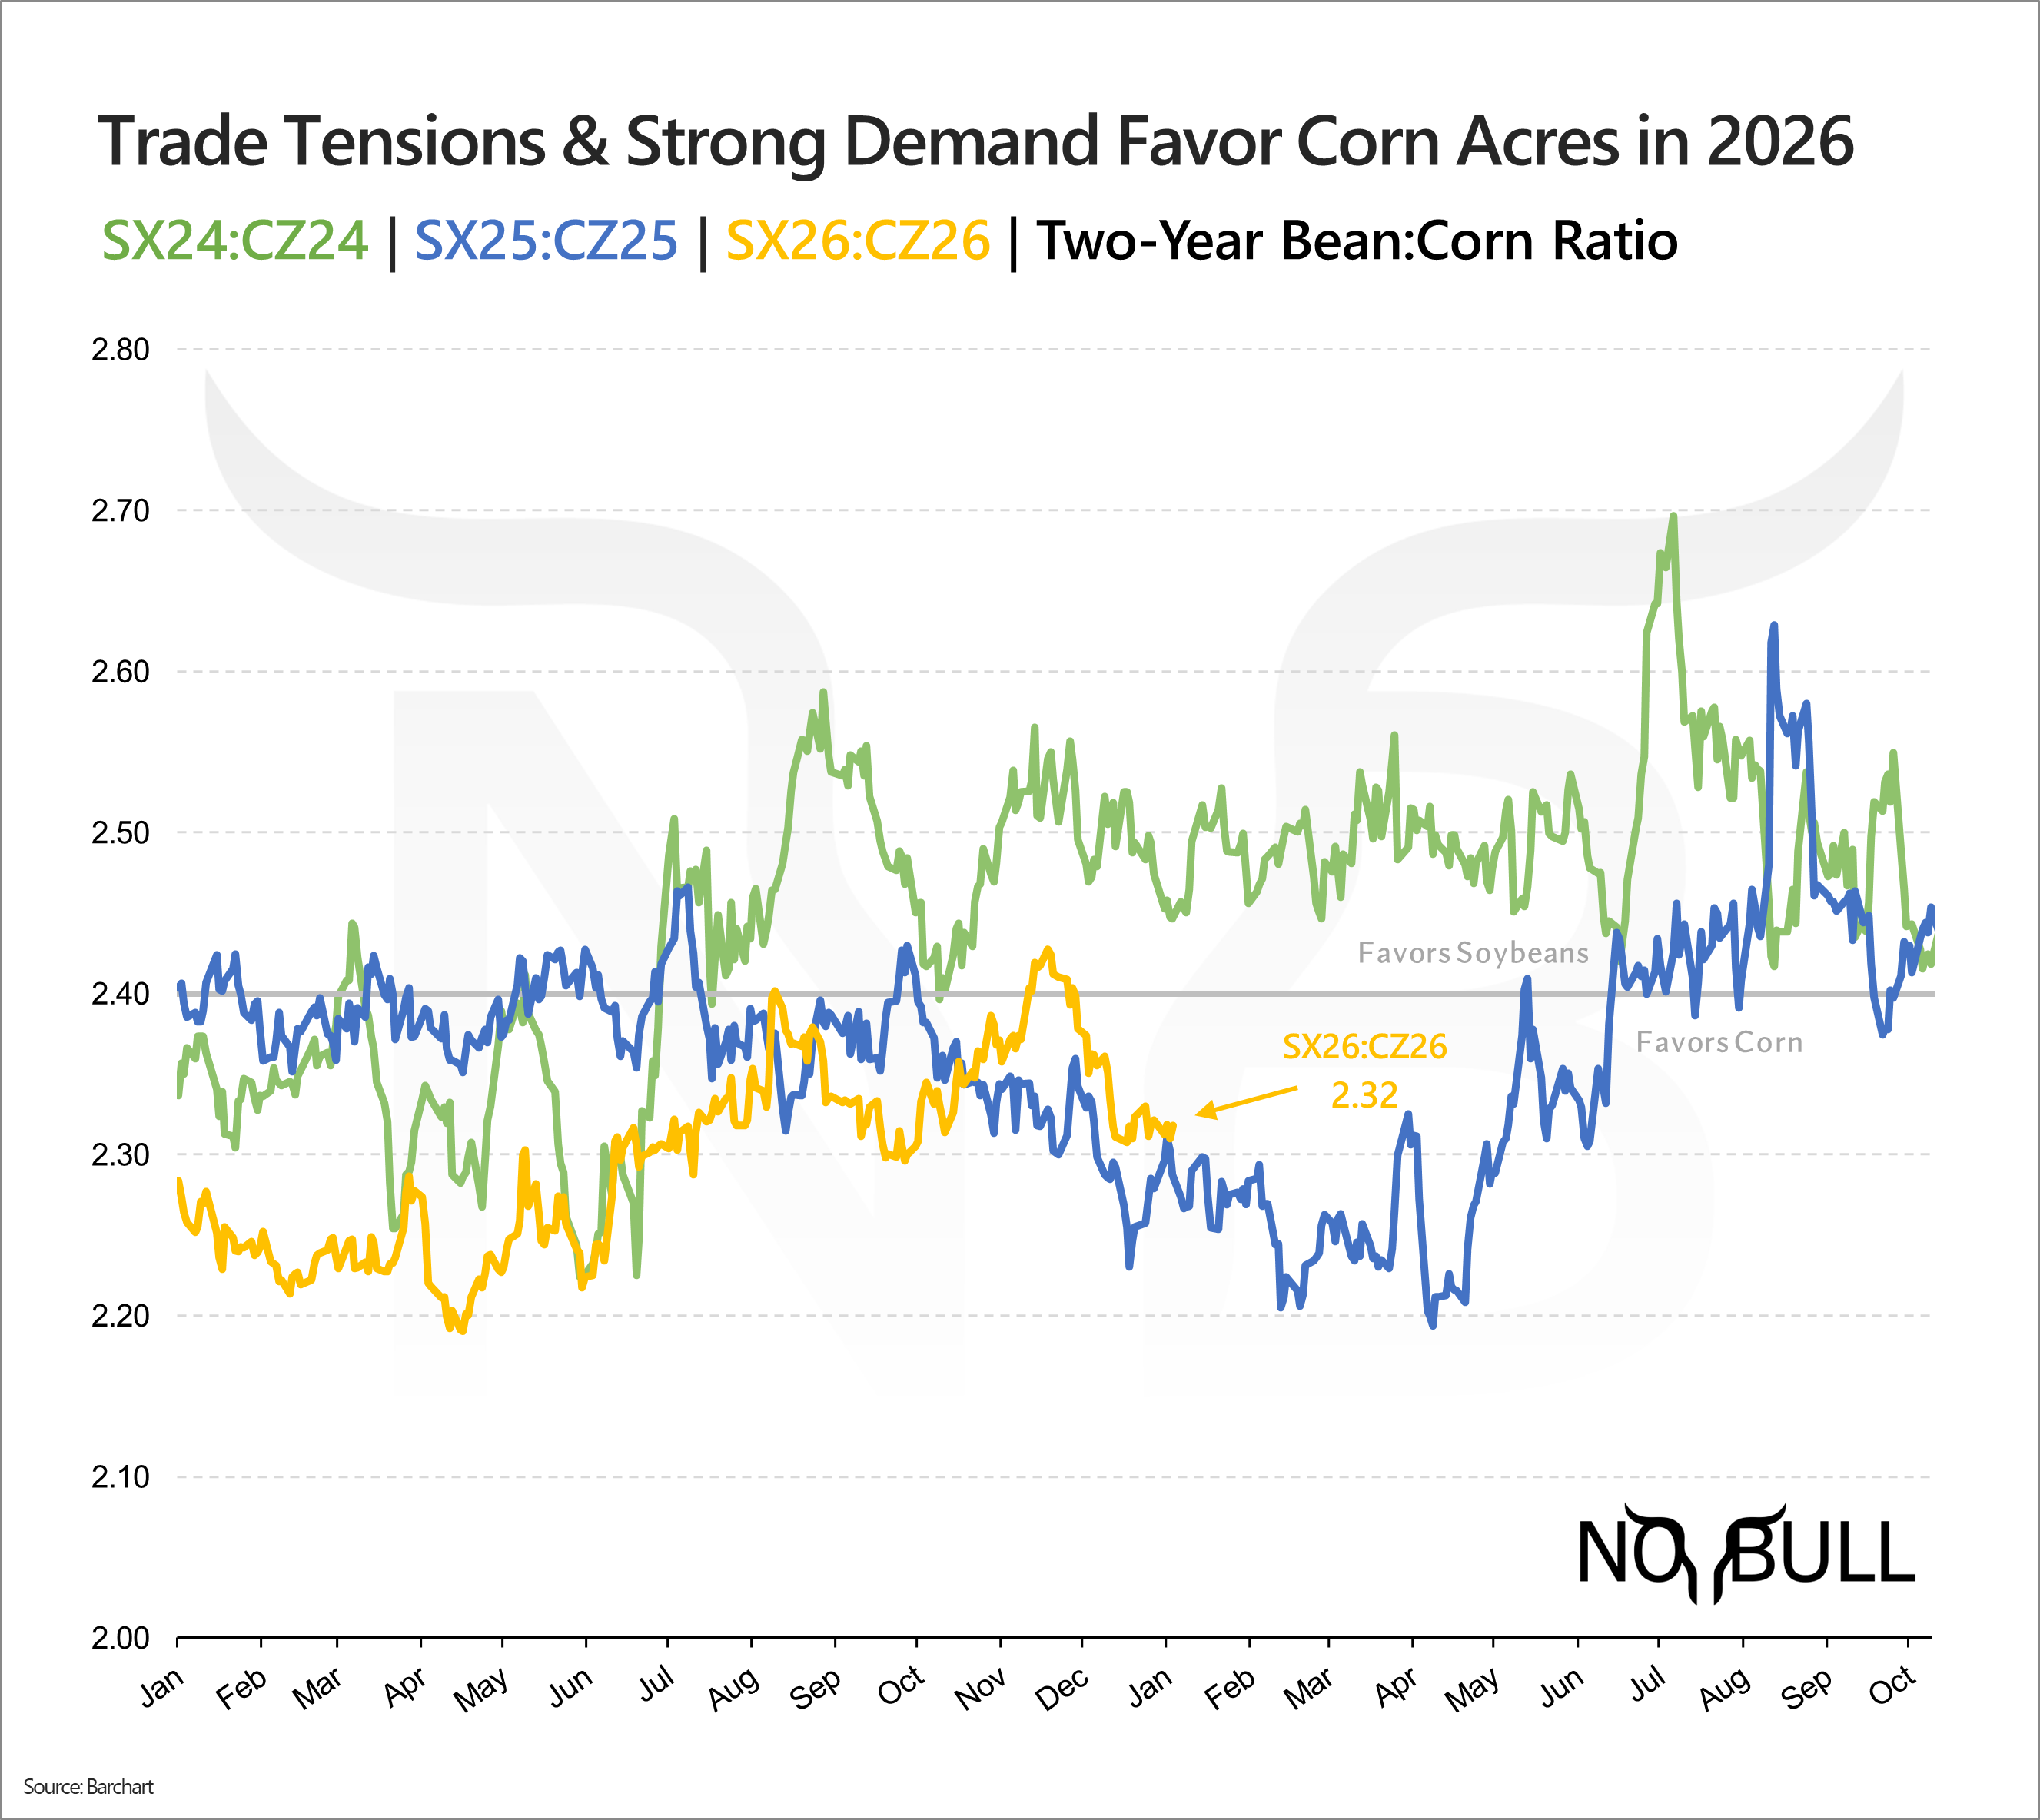
1 | King Corn
The soybean-to-corn ratio continues to favor corn into 2026, reinforcing the likelihood of another year of large corn acreage as strong corn demand overshadows lingering concerns about the year-on-year soybean sales deficit — even with China back in the U.S. market. Even with both crops trading below estimated costs of production, corn remains the relative leader, especially as alternatives like cotton and rice trade at multi-year lows.
For the full version of this update or to subscribe, visit NoBullAg.com.

/Microsoft%20headquarters%20By%20Peter.jpeg)
/NVIDIA%20Corp%20logo%20outside%20building-by%20BING-JHEN_HONG%20via%20iStock.jpg)
/Micron%20Technology%20Inc_%20logo%20on%20building-by%20vzphotos%20vis%20iStock.jpg)
/Amazon%20-%20Image%20by%20bluestork%20via%20Shutterstock.jpg)
