
Markets enter 2026 at a crossroads. Oil prices remain subdued but volatile, interest rates are holding steady despite rate-cut hopes, and the S&P 500 continues to climb on the back of strong earnings.
Each of these trends reflects deeper macro shifts—from energy supply dynamics to Fed policy uncertainty to renewed corporate momentum.
These three charts—WTI crude, the 10-year Treasury yield, and the S&P 500—offer early signals that could shape investor behavior and market performance in the months ahead.
Oil: Prices Are Low Now, But There’s a Paradox in Play
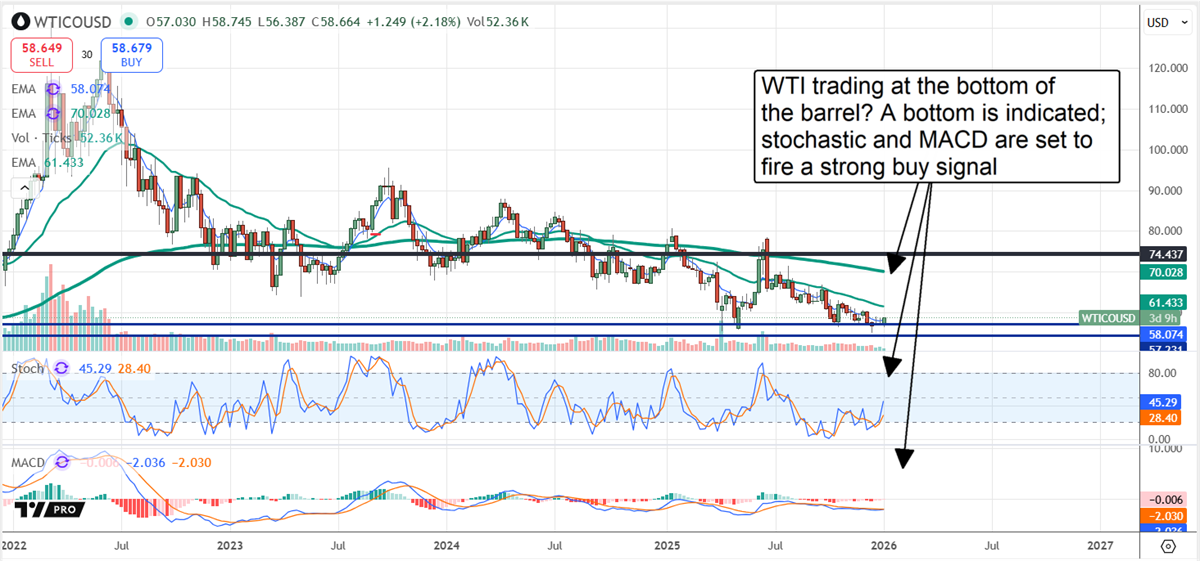
Oil prices are low now, but a supply-demand paradox in which low prices beget improving demand, which underpins price action, is in play. The critical takeaway is that although most estimates agree that oversupply will cap oil prices in 2026, there is ample uncertainty in the forecasts, demand is expected to increase, and factors such as geopolitics and economic growth are also driving the market.
West Texas Intermediate (WTI), the U.S. benchmark for crude oil, is a key pricing reference for global energy markets and reflects underlying supply and demand dynamics.
GDP is expected to grow by 3.0% to 3.5% globally this year, underpinned by emerging markets and the expansion of the middle class. The middle-class, which accounts for 30% to 40% of GDP globally, drives energy demand through increased access to transportation, housing, and heating,
Turning to the chart, the WTI price in early January is trading near long-term, multi-year lows, significant in more ways than one. At this level, oil prices underpin the slowdown of inflation but pose a risk for investors. The price action signals a technical bottom and a high probability of a rebound, provided a catalyst emerges. WTI price gains could run into the double-digit range in this scenario, keeping inflation steady if not increasing as input costs rise throughout the system. The other risk is that oil prices fall through their floor, sapping energy companies' earnings power and putting their capital returns at risk.
The 10 Year Treasury Yield Doesn’t Look All That Bearish
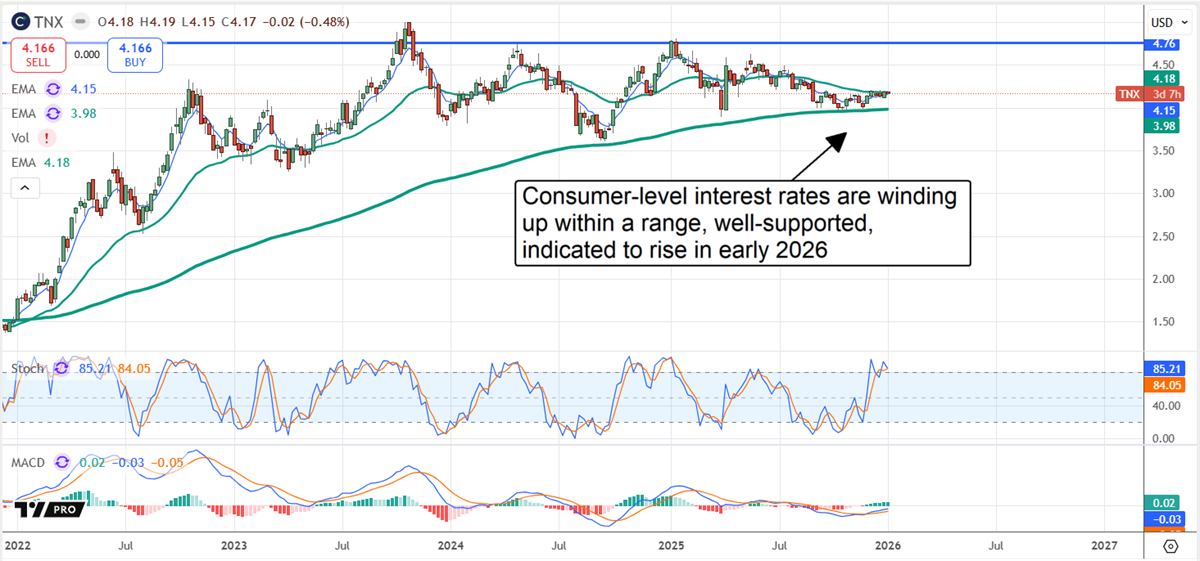
The 10 Year Treasury Yield, a market proxy for the FOMC interest rate, doesn’t look all that bearish. Investors expecting interest rates to fall significantly are likely to be disappointed. If anything, this market is winding up in a tightening range, ready for a squeeze that will likely leave it trending sideways. While inflation has cooled, it isn’t cool enough for the Fed to let off the economic brake. On the other hand, while labor markets have cooled, they still show signs of resilience and underlying health, so there is no reason for an aggressive cut. what
The most current data, as of early January, are initial jobless claims, which indicate a labor market trending steadily within a healthy range and showing signs of improvement at year’s end. The takeaway, as reflected in the CME Fedwatch Data, is that interest rates are only expected to fall slightly in 2026. The estimates could be optimistic, assuming the AI investment cycle continues to gain momentum, and the anticipated tailwinds from legislative change take effect. Looking at this chart, there is more risk that consumer-level interest rates will increase as the year progresses than decrease.
The S&P 500 Is in a Sweet Spot, Trending Higher on Earnings Growth
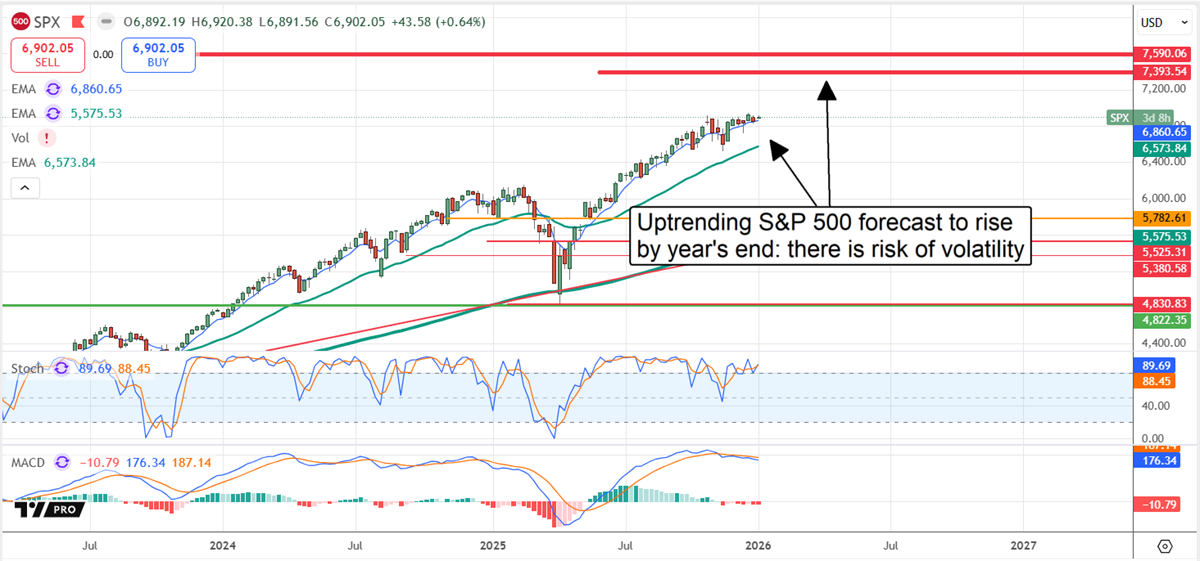
The S&P 500 rallied in 2025 and is likely to extend the gains in 2026. The average estimate is a move to the 7,500 region, while the high end runs above 8,000, a more than 15% upside driven by earnings growth and capital returns. Earnings growth is the primary driver, as the outlook includes sustained growth for the current and subsequent three quarters, growth accelerating sequentially, and estimates have been rising. In this environment, the index can continue rallying indefinitely, easily reaching the target range by mid-year.
While there is risk to the outlook, the index (and the ETF that tracks it) appears well-positioned, regardless of where interest rates go. An increase will be linked to economic activity, which is bullish for stocks, while a decline will be bullish for economic activity and also for stocks. The takeaway is that oil prices and interest rate outlooks are uncertain, likely to cause volatility in stocks, but the trend is up and may gain momentum as the year progresses.
Where Should You Invest $1,000 Right Now?
Before you make your next trade, you'll want to hear this.
MarketBeat keeps track of Wall Street's top-rated and best performing research analysts and the stocks they recommend to their clients on a daily basis.
Our team has identified the five stocks that top analysts are quietly whispering to their clients to buy now before the broader market catches on... and none of the big name stocks were on the list.
They believe these five stocks are the five best companies for investors to buy now...
The article "3 of the Most Important Charts to Watch Right Now" first appeared on MarketBeat.
/Super%20Micro%20Computer%20Inc%20logo%20on%20building-by%20Poetra_RH%20via%20Shutterstock.jpg)
/Intel%20Corp_%20Santa%20Clara%20campus-by%20jejim%20via%20Shutterstock.jpg)
/A%20Palantir%20office%20building%20in%20Tokyo_%20Image%20by%20Hiroshi-Mori-Stock%20via%20Shutterstock_.jpg)
/A%20photo%20of%20a%20Sandisk%20Solid%20State%20Drive%20by%20Top%20Popular%20Vector%20by%20Shutterstock.jpg)
/AI%20(artificial%20intelligence)/Businessman%20work%20with%20ai%20for%20economy%20analysis%20financial%20result%20by%20digital%20augmented%20reality%20graph%20by%20Natee%20K%20Jindakum%20via%20Shutterstock.jpg)