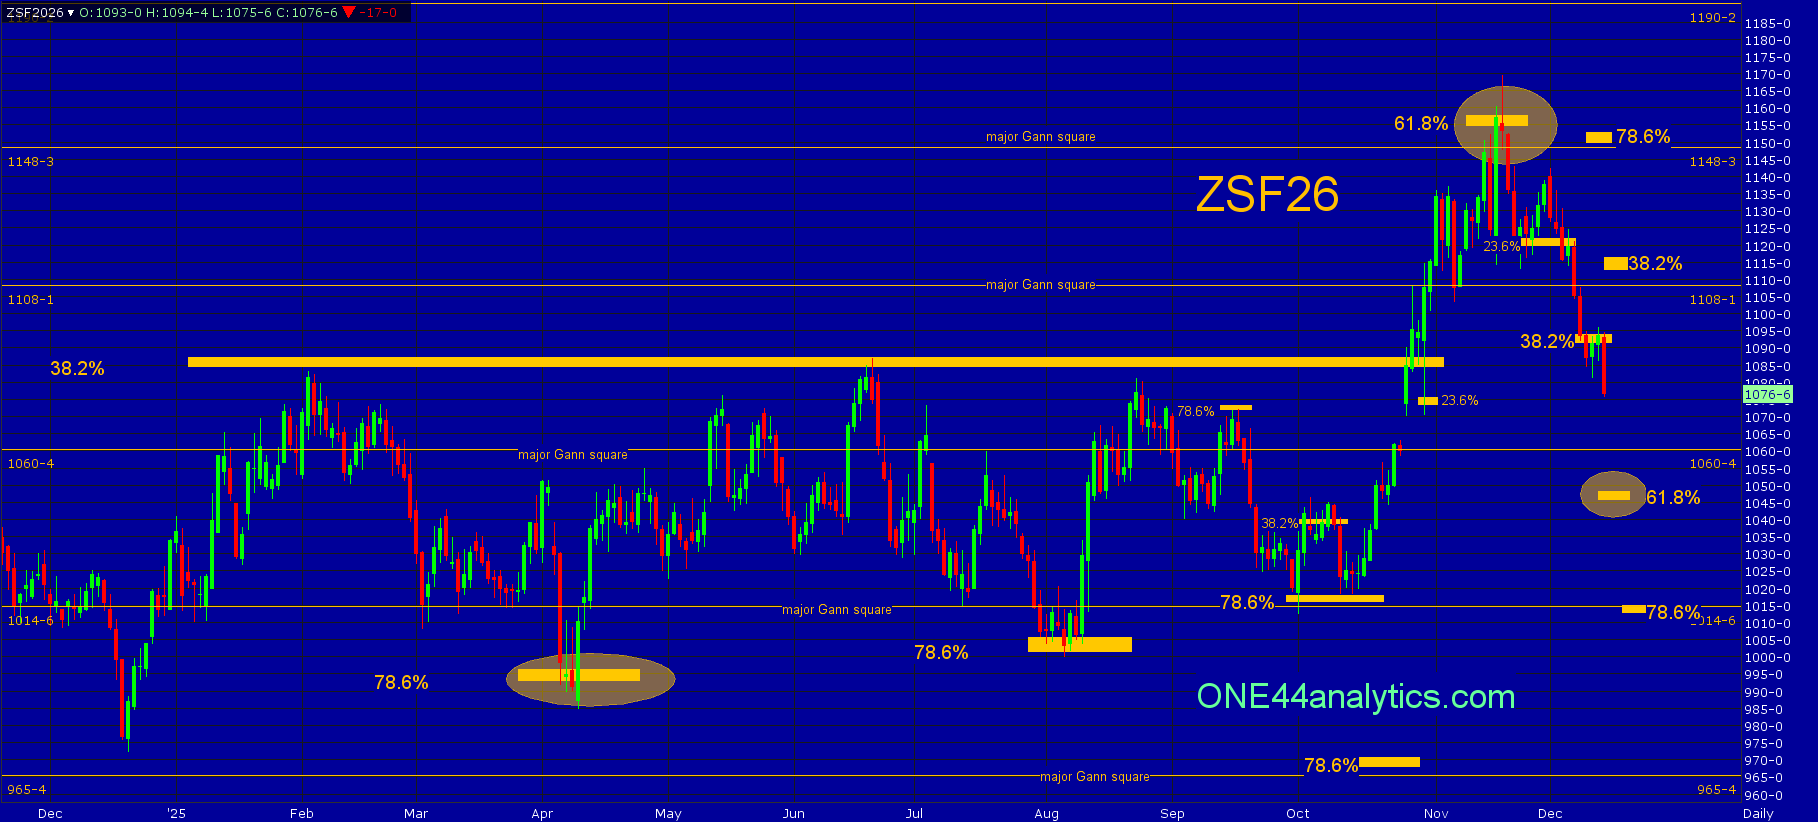
The Break In Soybeans For 61.8% (1154.00) And The 1148.25 Major Gann Square Continues, Here Is Our Target.
The chart is key to this analysis.
There are two methods we use at ONE44 to find support and resistance in the markets.
The first are major Gann squares, these are the yellow horizontal lines on the chart.
The second is Fibonacci retracements.
When we follow the ONE44 61.8% rule we know,
Whenever the market holds 61.8% of a move, look for it to go 61.8% of where it just came from. This usually happens when a market is directionless, or in a consolidation period.
When a market hits 61.8% it tells us two things, one, that we should look for 61.8% back of the current move and two, once dealing with very large ranges that it tends to mean the market is going into a choppy trading range with big swings. For how long? This all depends on the size of the range and the time spent to produce the two levels that the retracement comes from.
This is our analysis on 11/20/25 using this rule, as it brings us to where we are today!
January
From last week,
The most it could setback from last week's high was down to the 1108.00 major Gann square keeping the market extremely positive and it made a new high. It has hit the first part of the short term target area of the 1148.25 major Gann square and 61.8% back to the contract high at 1154.00. The key level for the week will be the 1148.25 major Gann square.
Use 1148.25 as the swing point for the week
Above it, you will still have to watch for a trade up to, or through the 61.8% level at 1154.00 and then a close back below 1148.25 as this can cause a sharp selloff.....
It did get a trade up to and through 61.8% at 1154.00 and then closed below the 1148.25 major Gann square and swing point for the week. The long term target is 61.8% the other way based on the ONE44 61.8% rule. The setback so far hit 23.6% back to the 12/19/24 low at 1122.00 and this will be the key level for the week. If this is all it can setback from 61.8% (1154.00) it would be a very strong sign and a new high can quickly follow.
Use 1122.00 as the swing point for the week.
Above it, the short term target is also the long term swing point at 1190.25, this is 38.2% on the continuation chart and a major Gann square. The next two levels to look for resistance and then use as the swing point are major Gann squares at 1228.00 and 1266.50.
Below it, the short term target is 38.2% back to the 12/19/24 low at 1094.00, this is the level that must hold to keep the uptrend intact. The long term target is 61.8% of the same move at 1048.00 based on the ONE44 61.8% rule.
ONE44 Analytics where the analysis is concise and to the point
Our goal is to not only give you actionable information, but to help you understand why we think this is happening based on pure price analysis with Fibonacci retracements, that we believe are the underlying structure of all markets and Gann squares.
If you like this type of analysis and trade the Grain/Livestock futures you can become a Premium Member.
You can also follow us on YouTube for more examples of how to use the Fibonacci retracements with the ONE44 rules and guidelines.
Sign up for our Free newsletter here.
FULL RISK DISCLOSURE: Futures trading contains substantial risk and is not for every investor. An investor could potentially lose all or more than the initial investment. Commission Rule 4.41(b)(1)(I) hypothetical or simulated performance results have certain inherent limitations. Unlike an actual performance record, simulated results do not represent actual trading. Also, since the trades have not actually been executed, the results may have under- or over-compensated for the impact, if any, of certain market factors, such as lack of liquidity. Simulated trading programs in general are also subject to the fact that they are designed with the benefit of hindsight. No representation is being made that any account will or is likely to achieve profits or losses similar to those shown. Past performance is not necessarily indicative of future results.
/A%20SoFi%20logo%20on%20an%20office%20building%20by%20Tada%20Images%20via%20Shutterstock.jpg)
/Stickers%20with%20AMD%20Radeon%20and%20Nvidia%20GeForce%20RTX%20graphics%20on%20new%20laptop%20computer%20by%20Piotr%20Swat%20via%20Shutterstock.jpg)