The information and opinions expressed below are based on my analysis of price behavior and chart activity
Thursday, October 23, 2025
If you like this article and would like to receive more information on the commodity markets from Walsh Trading, please use the link to join our email list -Click here
Every morning, at about 8 AM CST, I post a short video highlighting where I see opportunities in the futures markets. You can view my most recent video here
December Live Cattle (Daily)
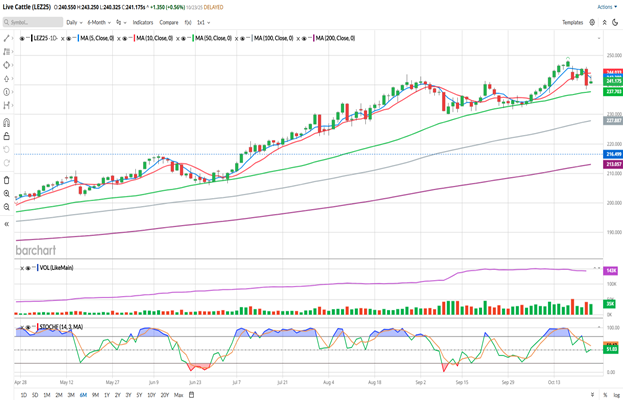
Today, the December Live Cattle futures closed at 241.175, up 1.350 on the day. A positive close following yesterday’s drop of 5.600. The market did close well off the highs of the day, however, which may indicate more selling pressure ahead. The 5- and 10-day moving averages (blue and red) made a bearish crossover yesterday and today’s trade did seem to find some resistance near that 5-day average (242.380 at the close) Live Cattle began their drop last Friday (after closing at new contract highs on Thursday) when President Trump started talking about doing something to bring the price of beef down on Thursday afternoon or evening. This week started on a bullish note, with Monday and Tuesday seeing gains, but unable to break out of Friday’s trading range.
There were rumors flying around, as to what the government could or would do, but those rumors were put to rest yesterday when the USDA released their actual plan and intentions. If you’re interested, you can read the USDA’s statement here. It’s a 13 page document that outlines plans to cut bureaucratic red tape, which will be helpful, I think, in the long term. At least, that’s how I read it. However, nowhere in that document do I read anything that increases our cattle herd. And to me, that’s the biggest driver behind this bull market. Our domestic herd size is at or near 70-80 year lows, our population has increased and consumers are still buying beef at the grocery store. The border with Mexico is still closed to cattle imports and will likely remain so until the New World Screwworm is mitigated to a point that we’re comfortable with it. Those efforts are ongoing, but I think they may take a long while. I’m not a construction-type guy, but I would imagine it takes a while to build facilities that are estimated to cost somewhere in the $700-$800 million range. Perhaps I’m wrong about that. Regardless, we’re still currently missing out on roughly 100k animals per month coming across the border. Heifer retention might be occurring now, but tomorrow’s Cattle on Feed report, which would give us a quarterly glimpse at those numbers, won’t be released due to the government shutdown. In the long-run, I’m still bullish Cattle.
The 50-day moving average (green, 237.703 today) has held as very good support every time it’s been tested or interacted with since June. That was 2 occasions in this chart view, will a third test also be a charm? Or will the market start a “real” retracement? I'm of the opinion that it might hold.
Cattle producers should be considering Put option positions to protect their downside, as that’s where they have the biggest risk. If the uptrend continues, would you rather have a loss of option premium or face margin calls against a short futures position?
Very aggressive and very-well margined traders may do well to consider establishing long futures position, should the market dip to/near the 50-day moving average, with an eye toward new contract highs. As I don’t know your account size and risk-tolerance, I’ll leave the entry and protective sell-stop levels up to you.
If you like what you’ve read here and would like to see more like this from Walsh Trading, please Click here and sign up for our daily futures market email.
Every morning, at about 8 AM CST, I post a short video highlighting where I see opportunities in the futures markets. You can view my most recent video here
December Live Cattle (Weekly)
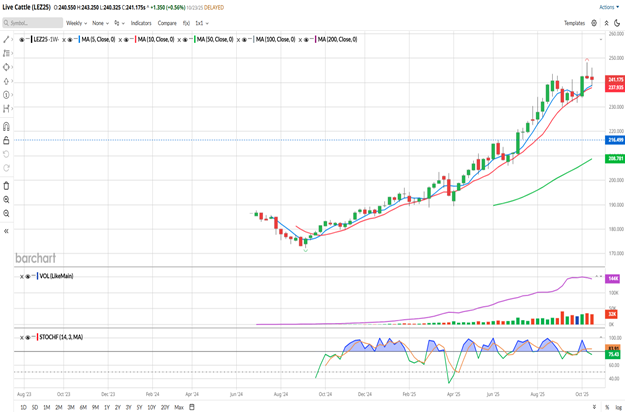
The weekly chart does look a little “toppy” at the moment, with last week’s large spike higher and subsequent bearish close. The market closed 0.70 lower last week, some 6.475 off the high. So far this week, prices are down just 0.650, but there’s still tomorrow to contend with.
The 5- and 10-week moving averages (blue and red) are still in a bullish configuration since they made a bullish crossover at/near 179.355 in the first week of October last year. Those are at 238.865 and 237.935, respectively. The 5-week has acted as support this week, with the market testing and bouncing a little away from it. The 50-week (green) is well below the market near 209.000 and pointing higher. Stochastics (bottom sub-graph) have ticked down out of an overbought condition. To my eye, this market has been overbought nearly the entire life of this chart and has never extended to oversold.
This trend has been strong. The market is likely in need of a pull back or retracement, perhaps to the June highs (blue dotted line near 216.500), but the highs from late August and early September are still holding as support well, in my opinion. Also, since the 4-week downtrend in July-August 2024, this market hasn’t strung together more than 2-weeks down. We’ll have to stay tuned to see if that pattern continues.
If you like what you’ve read here and would like to see more like this from Walsh Trading, please Click here and sign up for our daily futures market email.
Every morning, at about 8 AM CST, I post a short video highlighting where I see opportunities in the futures markets. You can view my most recent video here
December Live Cattle (Monthly Continuous Chart)
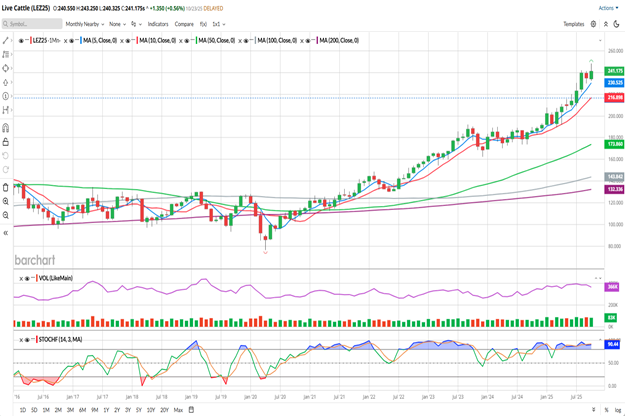
This monthly continuous chart for Live Cattle futures shows me a market that has been in a strong uptrend since this market made it’s “Covid low” in April of 2020. Perhaps a little later than that, depending on you define trend change, as the market didn’t start to close consistently above the 200-month moving average (purple) until November 2020. Either way, that’s about a 5 year rally in Cattle prices. There have been a few downturns in price since then, but the trend has remained. February-May of 2022 and October-December of 2023, jump out at me as the most significant. The market also went into a consolidation phase, when it traded sideways or remained in a range, that lasted from roughly September 2023 to November of 2024. Over the past year or so, the uptrend has continued. The long-term moving averages displayed on this chart are the 50-month, 100-month and 200-month (green, grey and purple) are all well below the market price and are all inclining higher, to varying degrees. The 5- and 10-month averages (blue and red) have been in a bullish configuration since May 2024. Stochastics (bottom sub-graph) are in an overbought condition, and have been since March of this year. Those averages have been tested on more than one occasion since then and have held as pretty solid support, in my opinion. Until those long-term trend markers are broken, I’m of the opinion that dips to support levels should be bought. By way of reference, the 5-month average is at/near 230.500 and the 10-month is at/near 217.000. The low so far this month has been 232.450, according to this chart, above the 5-month average, but there’s still a week or so left in this month.
Jefferson Fosse Walsh Trading
Direct 312 957 8248 Toll Free 800 556 9411
jfosse@walshtrading.com www.walshtrading.com
Walsh Trading, Inc. is registered as a Guaranteed Introducing Broker with the Commodity Futures Trading Commission and an NFA Member.
Futures and options trading involves substantial risk and is not suitable for all investors. Therefore, individuals should carefully consider their financial condition in deciding whether to trade. Option traders should be aware that the exercise of a long option will result in a futures position. The valuation of futures and options may fluctuate, and as a result, clients may lose more than their original investment. The information contained on this site is the opinion of the writer or was obtained from sources cited within the commentary. The impact on market prices due to seasonal or market cycles and current news events may already be reflected in market prices. PAST PERFORMANCE IS NOT NECESSARILY INDICATIVE OF FUTURE RESULTS. All information, communications, publications, and reports, including this specific material, used and distributed by Walsh Trading, Inc. (“WTI”) shall be construed as a solicitation for entering into a derivatives transaction. WTI does not distribute research reports, employ research analysts, or maintain a research department as defined in CFTC Regulation 1.71.
/Microsoft%20Corporation%20logo%20on%20sign-by%20Jean-Luc%20Ichard%20via%20iStock.jpg)
/Micron%20Technology%20Inc_%20logo%20on%20building-by%20vzphotos%20vis%20iStock.jpg)
/Alphabet%20Inc_%20and%20Google%20logos%20seen%20displayed%20on%20a%20smartphone%20by%20IgorGolovniov%20via%20Shutterstock.jpg)
/Phone%20and%20computer%20internet%20network%20by%20Pinkypills%20via%20iStock.jpg)
/NVIDIA%20Corp%20logo%20on%20phone-by%20Evolf%20via%20Shutterstock.jpg)