
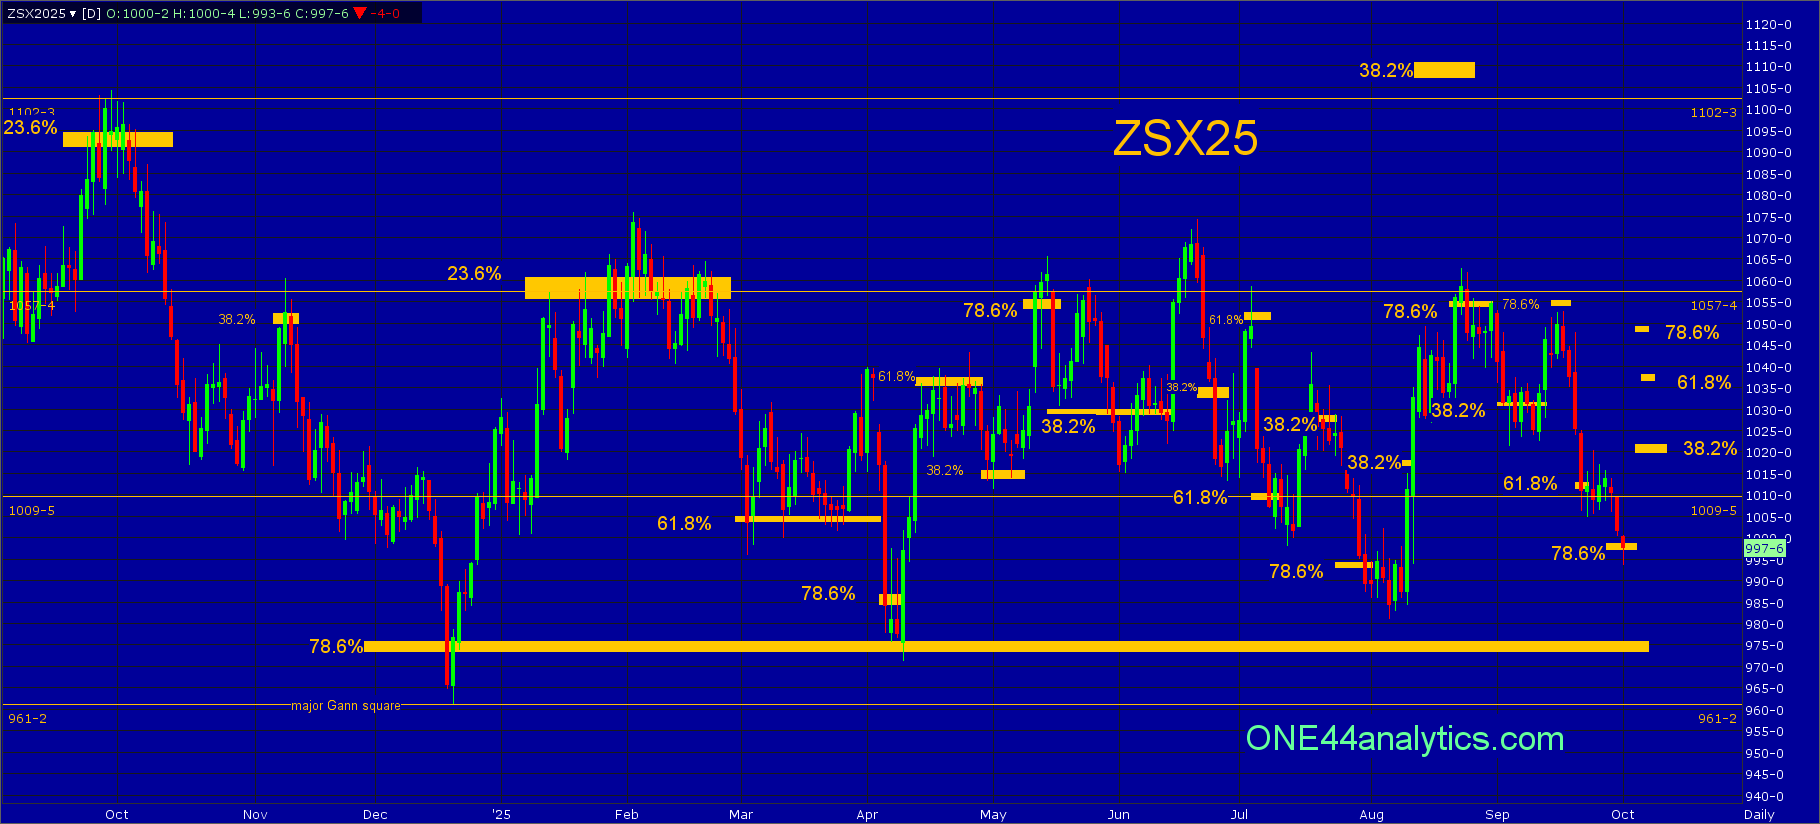
Soybean complete 78.6% (1054.00) to 78.6% target at 999.00, per the ONE44 78.6% rule.
The chart is key to this analysis.
.
The ONE44 78.6% rule,
Any market that hits 78.6% should go 78.6% back the other way. This is also where a lot of Bull markets end and start.
When a market does react to 78.6% it usually creates wide swings that go through all the other retracements, this either happens in very large trading ranges or very small, it is also the level hit most often when the market is reacting from 23.6% and 38.2% and fails to make the new high/low. This is where a lot of Bull runs start and end.
.
Here is this weeks Soybean analysis we sent out on 10/1/25,
Soybeans
November
From last week,
The break this week completed the first 78.6% (1054.00) to 78.6% at 1028.00 per the ONE44 78.6% rule and it also hit the longer term target area of 61.8% (1013.00) and the 1009.50 major Gann square, this will be the key level for the week. With 1013.00 being 61.8% the short term target will be 61.8% the other way per the ONE44 61.8% rule. The second 78.6% target would be completed with a trade down to 999.00.
Use 1009.50 as the swing point for the week.
Below it, the short term target is 78.6% the other way at 999.00 this is the target from the 78.6% level at 1054.00, following the ONE44 78.6% rule. The longer....
With today's low it has now completed the 78.6% (1054.00) to 78.6% long term target at 999.00 following the ONE44 78.6% rule. This will be the key level for the week. We will use the same rule for the long term upside target. The sideways trade between the 1057.50 and 961.25 major Gann squares continues to grow and as long as it can hold above the long term 78.6% Fibonacci retracement at 976.00 we think a long term Bull market can come from this base.
Use 999.00 as the swing point for the week.
Above it, The short term target is 38.2% back to the 8/22/25 high at 1020.00, this is the level that needs to be taken out to turn the short term trend positive. The long term target is 78.6% the other way at 1048.00 based on the ONE44 78.6% rule. Any rally that can't get above the 1009.50 major Gann square is a negative sign and a new low can quickly follow.
Below it, the short term target is the long term 78.6% level at 976.00, a failure to turn higher from this area will give us only major Gann squares to look for support and then use as the swing point when closed below, the next two are 961.25 and 911.00.
ONE44 Analytics where the analysis is concise and to the point
Our goal is to not only give you actionable information, but to help you understand why we think this is happening based on pure price analysis with Fibonacci retracements, that we believe are the underlying structure of all markets and Gann squares.
If you like this type of analysis and trade the Grain/Livestock futures you can become a Premium Member.
You can also follow us on YouTube for more examples of how to use the Fibonacci retracements with the ONE44 rules and guidelines.
Sign up for our Free newsletter here.
FULL RISK DISCLOSURE: Futures trading contains substantial risk and is not for every investor. An investor could potentially lose all or more than the initial investment. Commission Rule 4.41(b)(1)(I) hypothetical or simulated performance results have certain inherent limitations. Unlike an actual performance record, simulated results do not represent actual trading. Also, since the trades have not actually been executed, the results may have under- or over-compensated for the impact, if any, of certain market factors, such as lack of liquidity. Simulated trading programs in general are also subject to the fact that they are designed with the benefit of hindsight. No representation is being made that any account will or is likely to achieve profits or losses similar to those shown. Past performance is not necessarily indicative of future results.

/Intel%20Corp_%20badge%20holder-by%20hasrul_rais%20via%20Shutterstock.jpg)
/Nvidia%20logo%20and%20sign%20on%20headquarters%20by%20Michael%20Vi%20via%20Shutterstock.jpg)
/AI%20(artificial%20intelligence)/Artificial%20intelligence%20and%20machine%20learning%20concept%20-%20by%20amgun%20via%20iStock.jpg)

/AI%20(artificial%20intelligence)/Data%20Center%20by%20Caureem%20via%20Shutterstock%20(2).jpg)