
It hasn’t been a good year for the US dollar. Not by a long shot. But today, I want to talk about why the CURRENT level of the US Dollar Index ($DXY) is so critical.
Take a look at the MoneyShow Chart of the Day, a weekly chart of the DXY going back almost 15 years. I’ve drawn in a couple of horizontal lines. The higher line shows a preliminary support zone – 99.60 to 100 – that we broke down through in April. The lower line shows a key support zone – 96.20 to 96.80 – that we’ve tested a couple of times the last few months.
DXY: The Long-Term View
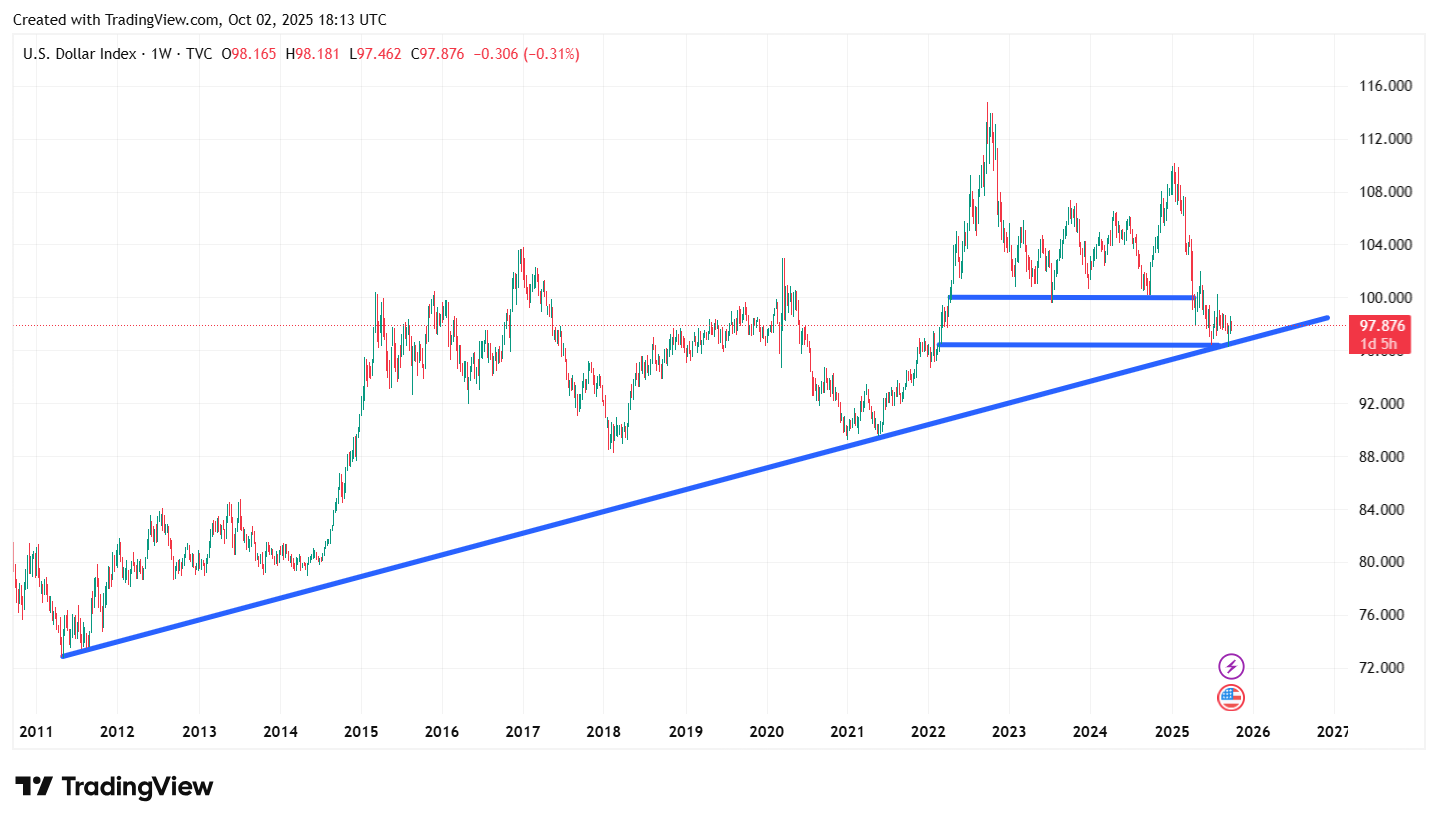
Source: TradingView
(If you want to get more articles and chart analysis from MoneyShow, subscribe to our Top Pros’ Top Picks newsletter here)
Now, look at the long-term uptrend line I’ve also drawn in. You can see that we’re testing a trendline that dates back to the post-Great Financial Crisis period.
If we fail here, it opens the door to a BIG decline. Let’s call it a drop to the 88-89 level first. If that doesn’t hold? We could see the high-70s further down the road.
Keep in mind these are LONG-TERM trends and potential technical developments I’m talking about. The forex market tends to move in a much more deliberate, gradual way than, say, your average AI stock! So, it could take weeks (or even a couple months) to find some kind of resolution.
But if the downside-break scenario DOES unfold, it would likely be accompanied by even MORE gains in precious metals…and MORE outperformance in foreign markets relative to US markets. So, keep a close eye on how things sort out. If the DXY can’t hold here, it would be a big deal for markets.

/AI%20(artificial%20intelligence)/3D%20Graphics%20Concept%20Big%20Data%20Center%20by%20Gorodenkoff%20via%20Shutterstock.jpg)
/Netflix%20on%20tv%20with%20remote%20by%20freestocks%20via%20Unsplash.jpg)

/Nvidia%20logo%20and%20sign%20on%20headquarters%20by%20Michael%20Vi%20via%20Shutterstock.jpg)
/NVIDIA%20Corp%20logo%20on%20phone-by%20Evolf%20via%20Shutterstock.jpg)