
The information and opinions expressed below are based on my analysis of price behavior and chart activity
Tuesday, August 19, 2025
If you like this article and would like to receive more information on the commodity markets from Walsh Trading, please use the link to join our email list -Click here
Every morning, at about 8 AM CST, I post a short video highlighting where I see opportunities in the futures markets. You can view my most recent video here
December Silver (Daily)
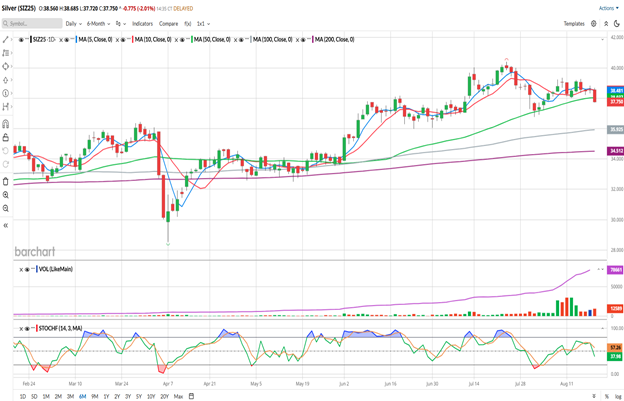
As of this writing, December Silver is down 0.775 cents, trading at 37.75. This market won’t stop trading until 4 PM CT, so I don’t have a settlement price yet. Since making the high on July 23rd at 40.405, Silver prices seem to be turning lower. Assuming that we settle, or close, around this level, this would mark the first close below that 50-day moving average (green, 38.036) Since May 16th. The market did test that average for 2 days in late July and early August, but did not close below the average. It acted as support, that time, this one may be shaping up differently. Following that test of support, the market did rally, but it ran out of steam on August 8th. If the bullish trend were to continue, I would have expected a move to new highs, eventually. Instead, the market posted what I call an “equilibrium day” that day, opening and closing at, or very near, the same price, followed by lower prices to today. In fact, yesterday’s trade was a Doji, where the market opened AND closed at 38.525. I look for a directional close, outside of the Doji range, for the next likely move. August 11th, we saw a bearish directional close, and the market was subsequently unable to even test the 39.350 high that occurred on the 8th. Today’s close would also be a bearish directional close, in my opinion. Sometimes the directional move lasts just a day or two, sometimes it’s the signal of a longer trend. We’ll have to stay tuned to find out which this might be.
Today the 5-and 10-day moving averages (blue/red, 38.478 and 38.539, respectively) are making a bearish crossover, which would normally indicate a weakening in trend and price. Stochastics (bottom sub-graph) have failed to get back to overbought status. You might notice that this market has been content to stay overbought for longer periods over the past six months, while the trend has been up. Currently that indicator is hooking back down, toward oversold, but is still roughly mid-range.
Aggressive and well-margined traders may do well to consider establishing short futures positions. There are mini and micro versions of Silver, if the full-size contract is too much for your account or risk tolerance, with the micro contracts offering significantly more volume and liquidity that the mini. (SOZ25 is the symbol on Barchart) Depending on where you choose to enter, a risk/reverse buy stop at or above yesterday’s high (38.830) may be a good idea. Potential targets, or support levels, may be found near the July 31st low of 36.770, the late June lows near 36.000, which corresponds, coincidentally, with the 100-day moving average, which is at 35.889 today. I don’t think the 200-day at 34.510 is in play yet, but that also corresponds with the highs late in May.
Less aggressive traders, or those that prefer options, may do well to consider buying Put options. The December options offer 97 days until expiration. Perhaps the 36.00 Puts, last traded at 1.018, or $5,090 out of pocket plus your commissions/fees would be useful. Place a GTC order to sell that option at 2x what you paid for it. If that’s too much out of pocket expense, consider a Put Spread. Something like Buying the December 37.00 Put and Selling the December 35.00 Put. Those options last traded at about a 74 cent difference, or about $3,700 out of pocket expense, before your commissions and fees.
If you like what you’ve read here and would like to see more like this from Walsh Trading, please Click here and sign up for our daily futures market email.
Every morning, at about 8 AM CST, I post a short video highlighting where I see opportunities in the futures markets. You can view my most recent video here
December Silver (Weekly)
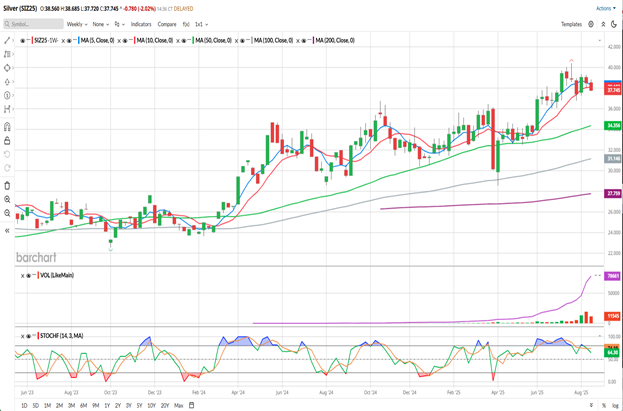
The weekly chart of December Silver shows a market that has been trending higher since March of 2024, as measured by closing prices above the 50-week (green) moving average. We’ve seen the market breach that once, in late March of 2025, but I think you might agree that average has been solid support for the past year and a half, or so. The peak posted 5 weeks (bars) ago, looks similar, to me anyway, to the peak posted in October 2024. Thos were both weeks that saw “new highs” before getting a bearish directional push to the 50-week average. That level is near 34.357 today and would seem a likely target , should the weakness continue to materialize. I’m not getting “bearish, bearish” if you understand my meaning, but I do think the charts indicate a market that wants, or needs perhaps, to see lower prices. The 5-and 10-week averages (blue/red, 38.304 and 38.103, respectively) are now above the market and offering potential resistance levels. You may notice that we haven’t seen a weekly close below that average since mid-May. There’s still 3 trading days left in the week, but we seem to heading in that direction at the moment. The 100-week average (grey, 31.236) and 200-week (purple, 27.759) are well below the market and I don’t think they’re in play, at this time. The Stochastic indicator (bottom sub-graph) has been more overbought than oversold, over the life of this chart, and is now pointing lower. It’s still at a relatively high level, 64.36 and 74.21, having been overbought for all of June and most of July.
If you like what you’ve read here and would like to see more like this from Walsh Trading, please Click here and sign up for our daily futures market email.
Every morning, at about 8 AM CST, I post a short video highlighting where I see opportunities in the futures markets. You can view my most recent video here
Jefferson Fosse Walsh Trading
Direct 312 957 8248 Toll Free 800 556 9411
jfosse@walshtrading.com www.walshtrading.com
Walsh Trading, Inc. is registered as a Guaranteed Introducing Broker with the Commodity Futures Trading Commission and an NFA Member.
Futures and options trading involves substantial risk and is not suitable for all investors. Therefore, individuals should carefully consider their financial condition in deciding whether to trade. Option traders should be aware that the exercise of a long option will result in a futures position. The valuation of futures and options may fluctuate, and as a result, clients may lose more than their original investment. The information contained on this site is the opinion of the writer or was obtained from sources cited within the commentary. The impact on market prices due to seasonal or market cycles and current news events may already be reflected in market prices. PAST PERFORMANCE IS NOT NECESSARILY INDICATIVE OF FUTURE RESULTS. All information, communications, publications, and reports, including this specific material, used and distributed by Walsh Trading, Inc. (“WTI”) shall be construed as a solicitation for entering into a derivatives transaction. WTI does not distribute research reports, employ research analysts, or maintain a research department as defined in CFTC Regulation 1.71.
/AI%20(artificial%20intelligence)/Hands%20of%20robot%20and%20human%20touching%20on%20big%20data%20network%20connection%20by%20PopTika%20via%20Shutterstock.jpg)


/Nvidia%20logo%20and%20sign%20on%20headquarters%20by%20Michael%20Vi%20via%20Shutterstock.jpg)