I last wrote about the U.S. dollar index on Barchart on May 9 when I asked if the index had bottomed, concluding:
Time will tell if the technical downside break leads to a test of the 90 level, which is the next support, or if the trade environment improves and the index returns toward the early 2025 high. At this point, the trend favors the downside.
The index was trading at the 100.23 level on May 9, after falling to a 97.92 on April 21. The index remained under pressure since May 9, falling to a low of 96 in early July. The index has bounced slightly higher from the early July low but remains in a bearish trend as of late-July.
The dollar index falls in Q2 and over the first half of 2025
The dollar index futures contract fell 7.11% in Q2 and was 10.4% lower over the first half of 2025.
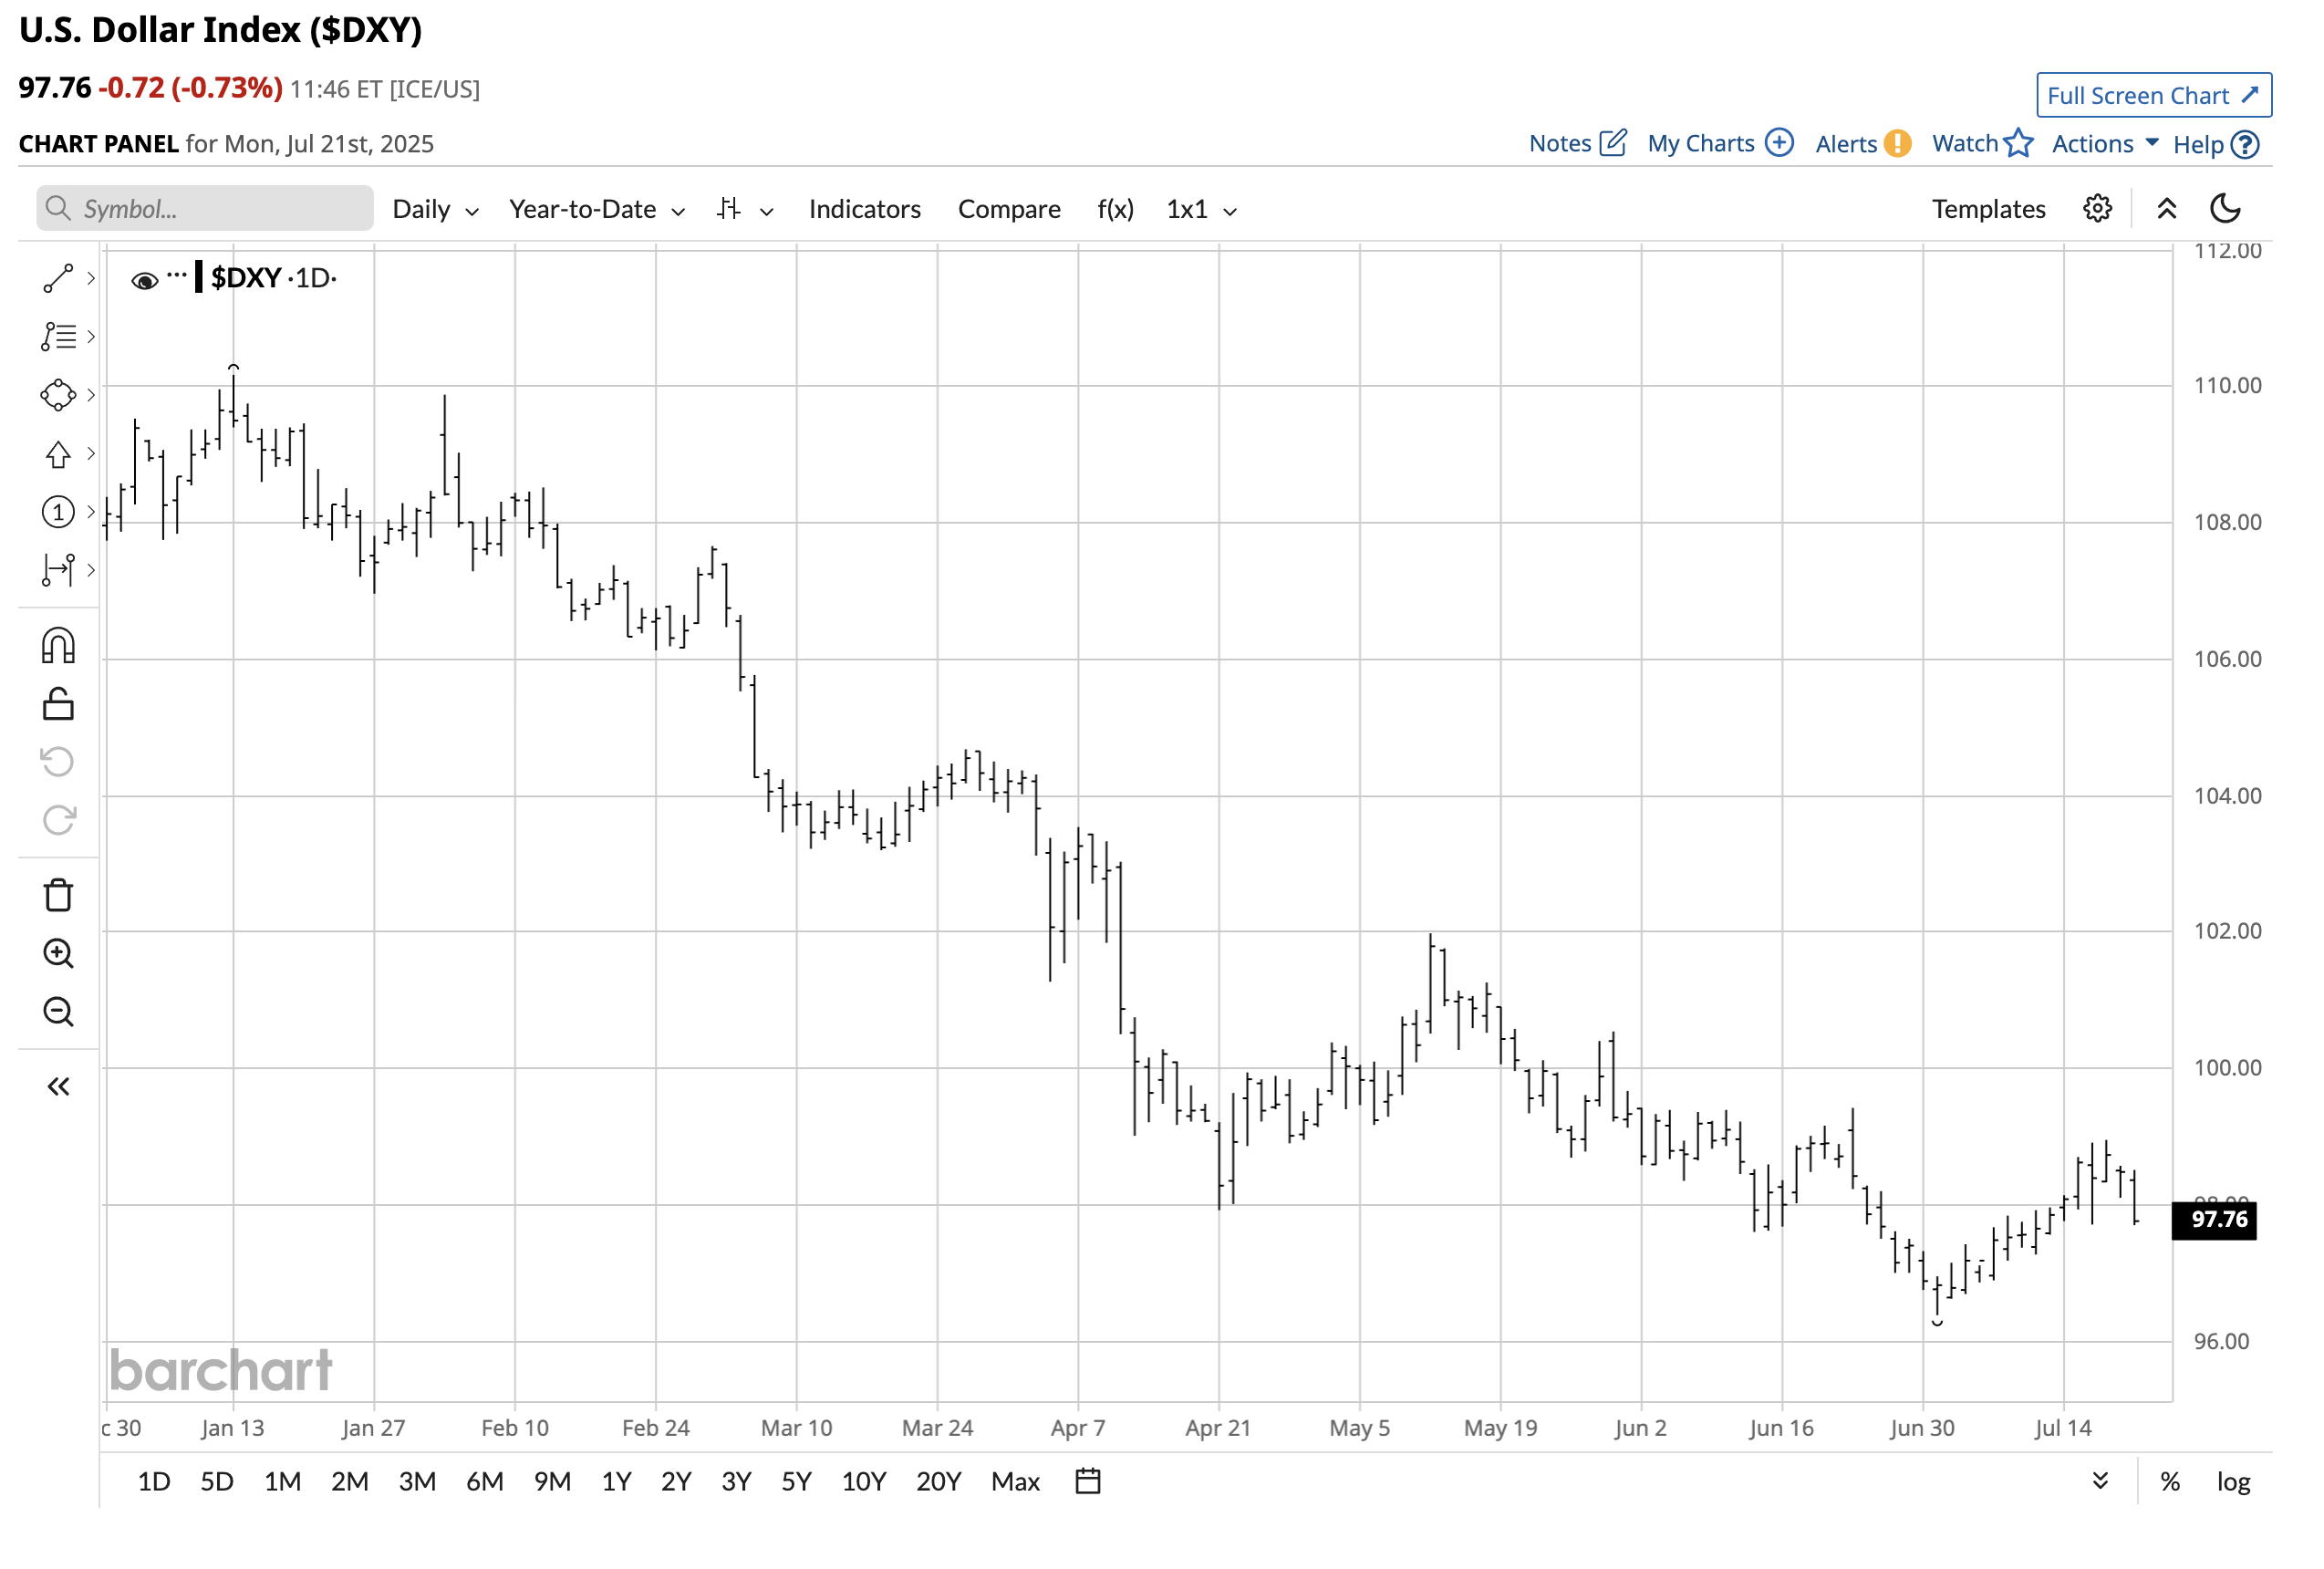
The year-to-date daily chart highlights the decline from the January 13 high of 110.17 to the most recent low of 96.38 on July 1, 2025, the first day of the third quarter.
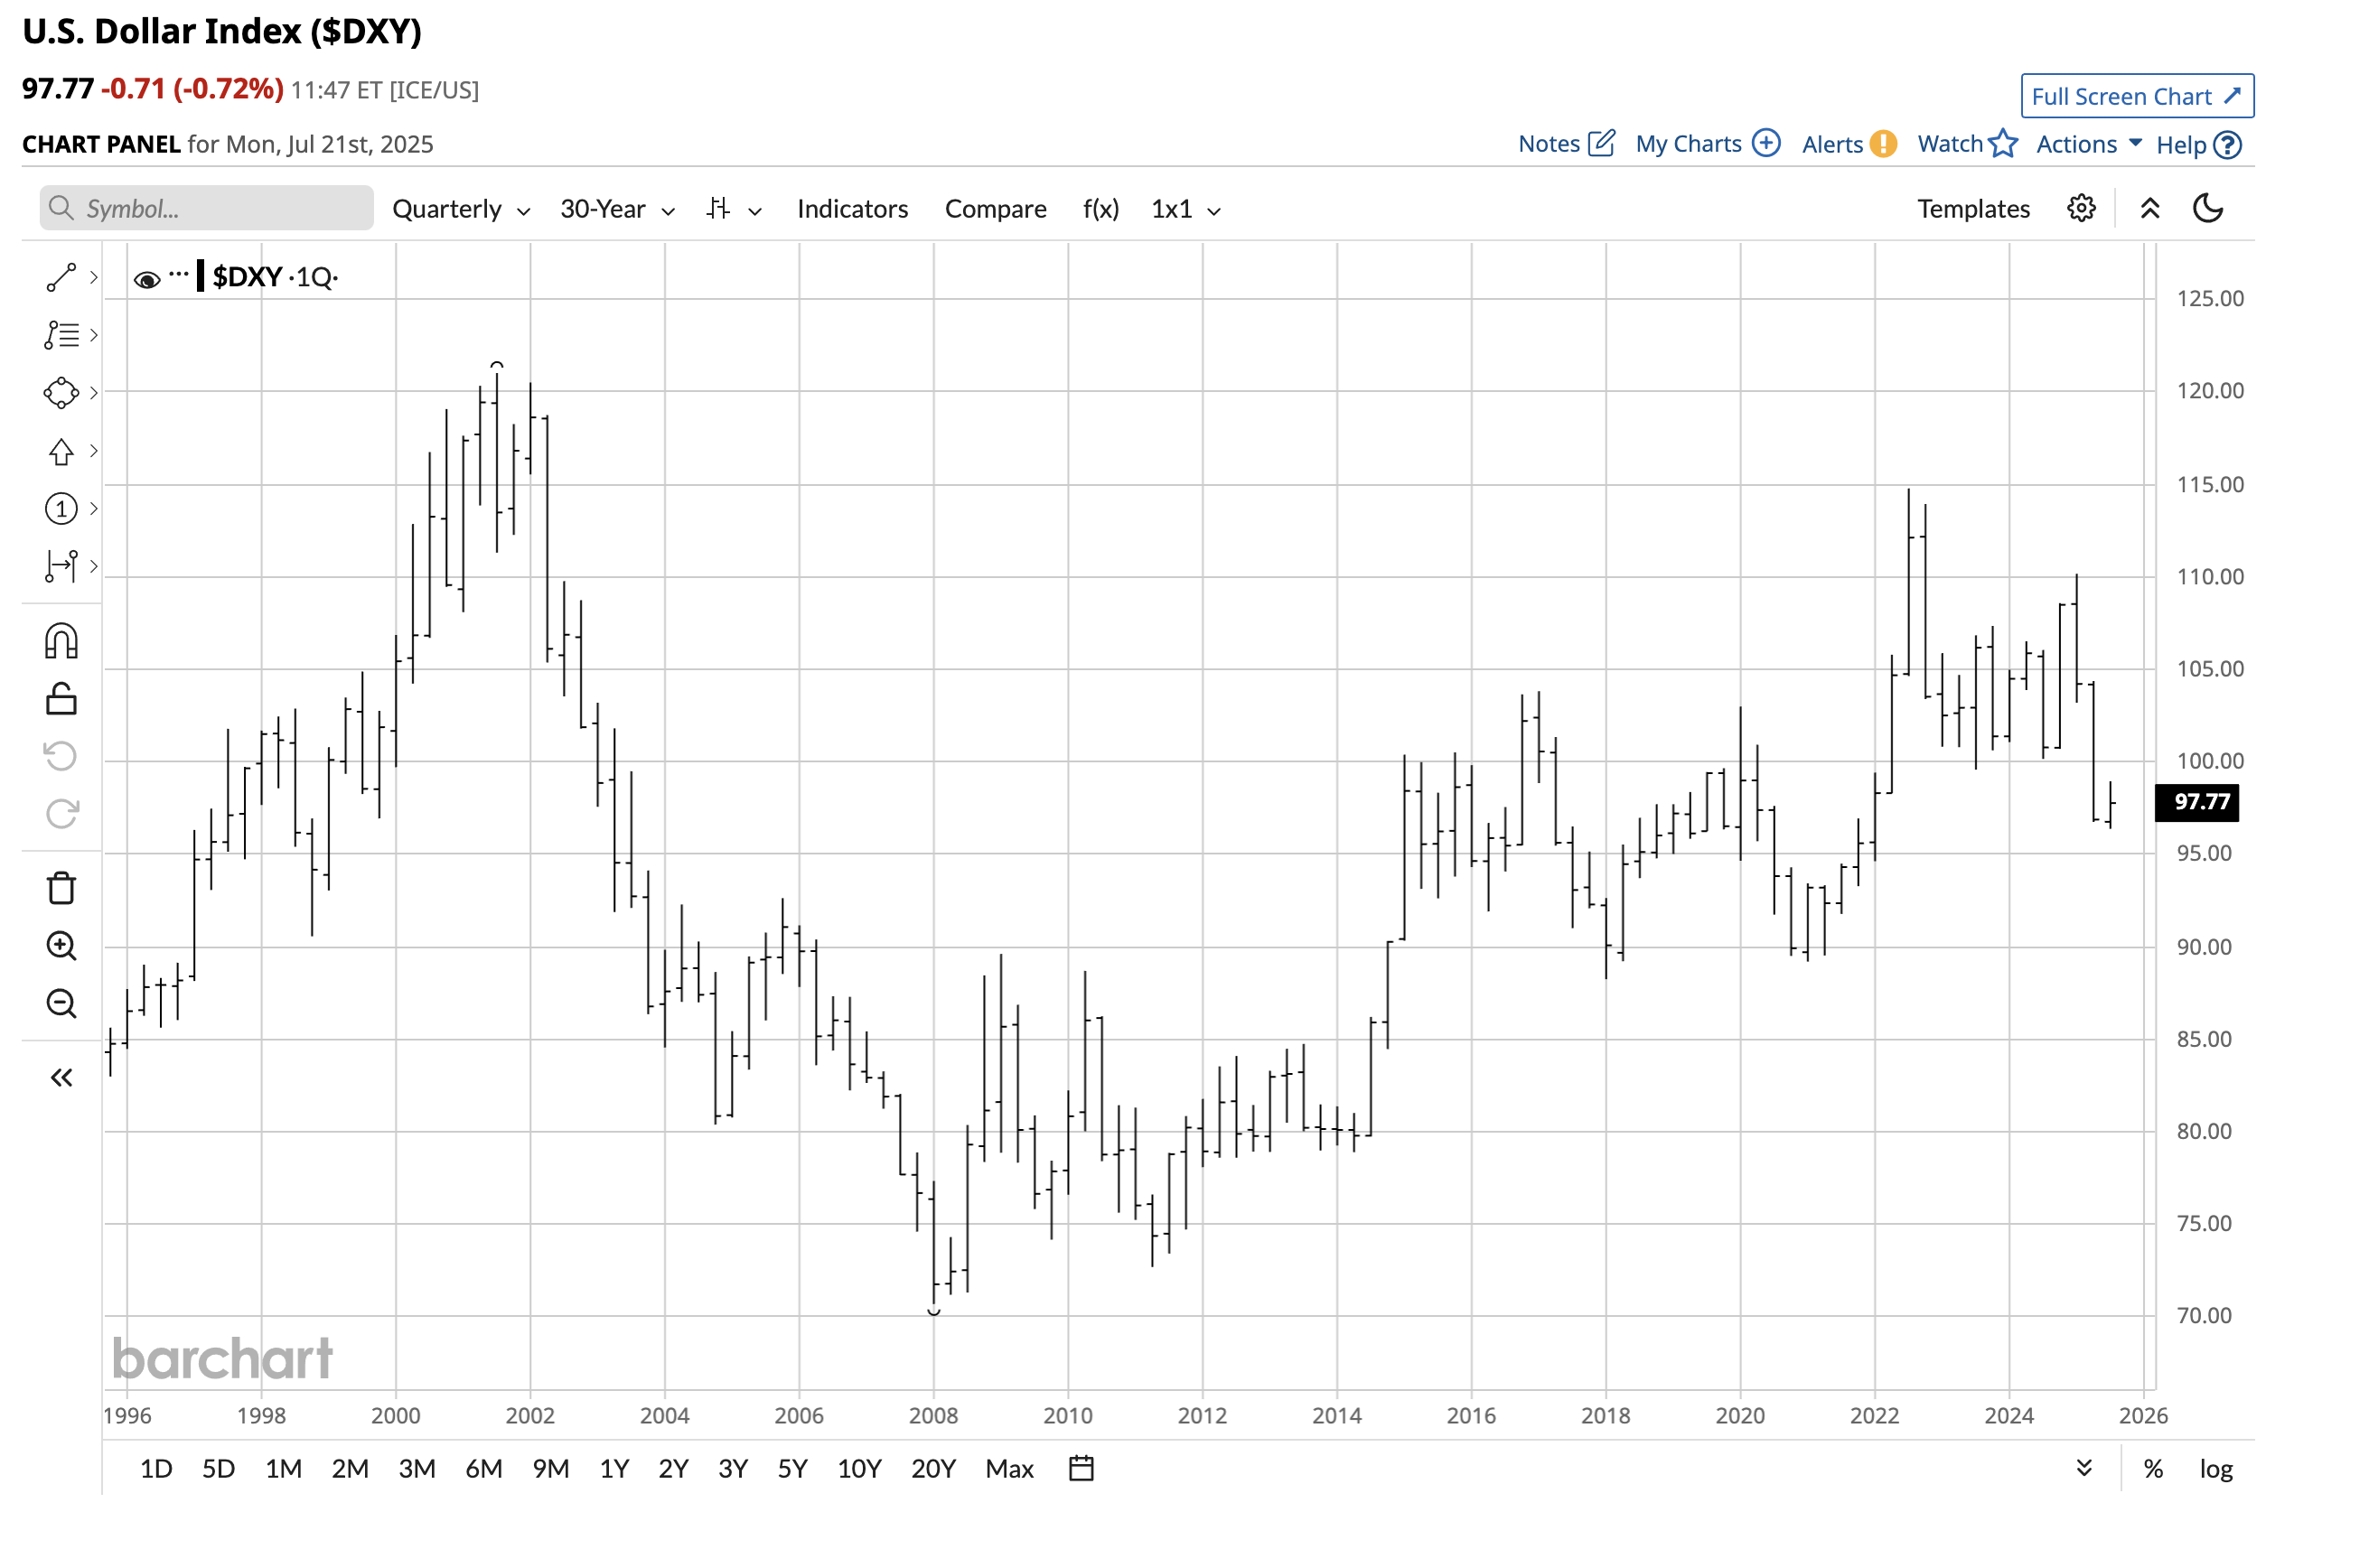
The thirty-year quarterly chart presents a confusing technical picture, as the trend since the 2008 low of 70.69 is bullish, with the dollar index making higher lows. However, the path of least resistance since the 2001 high of 121.02 is bearish, with lower highs.
The short-term trend is clearly lower, while the longer-term trends are unclear.
Lower interest rates could send the dollar index lower
The Trump administration and the U.S. Federal Reserve, under Chairman Jerome Powell, have been at odds since the 47th President took office in January 2025. Ironically, President Trump appointed Chairman Powell during his first term.
The Fed Funds Rate has remained at a midpoint of 4.375% throughout 2025 after falling by 1% in 2024. The President has criticized Chairman Powell, saying that U.S. rates should be 2% to 3% lower. In contrast, the Fed Chairman and the majority of the FOMC have cited the inflationary impact of tariffs on their decision to keep short-term rates stable. Meanwhile, the June consumer price index data, released on July 15, showed an increase of 0.3%, putting the twelve-month inflation rate at 2.7%, which was in line with expectations. Core inflation, excluding food and energy prices, rose 0.2%, bringing the annual rate to 2.9%, in line with forecasts. While vehicle prices declined, prices for apparel and home furnishings increased in June.
President Trump is likely to get his way if the inflation rate remains around the current level, as Chairman Powell’s term will end in May 2026. Moreover, there have been increasing calls for the current Chairman’s resignation due to cost overruns for refurbishing the Federal Reserve’s headquarters. President Trump will appoint Chairman Powell’s successor and new members of the Fed. His appointments will undoubtedly support an easier monetary policy stance and Fed Funds Rate reductions.
Since interest rate differentials are a critical factor for the value of one currency versus others, falling short-term U.S. interest rates could weigh on the dollar index. Moreover, the U.S. debt, at over $37 trillion and rising, is not bullish for the value of the U.S. currency.
Gold and precious metals send a signal to the dollar and all fiat currencies
Gold prices have reached new record highs for seven consecutive quarters. Silver traded at its highest price since 2011, reaching over $39.50 per ounce on July 14. Silver, platinum, and palladium formed bullish key reversal patterns on their respective quarterly charts in the second quarter of 2025.
The ascent of precious metals, which are financial assets with diverse industrial applications, serves as a commentary on the value of the U.S. dollar and that of all fiat currencies. Currencies derive value from the full faith and credit of the governments that issue legal tender and government debt securities. Gold and precious metals have rallied across all currency terms, which is a commentary on the value of fiat currencies, including the U.S. dollar.
The technical support remains around the 90 level
The dollar index’s seven-year monthly chart highlights the downside target.
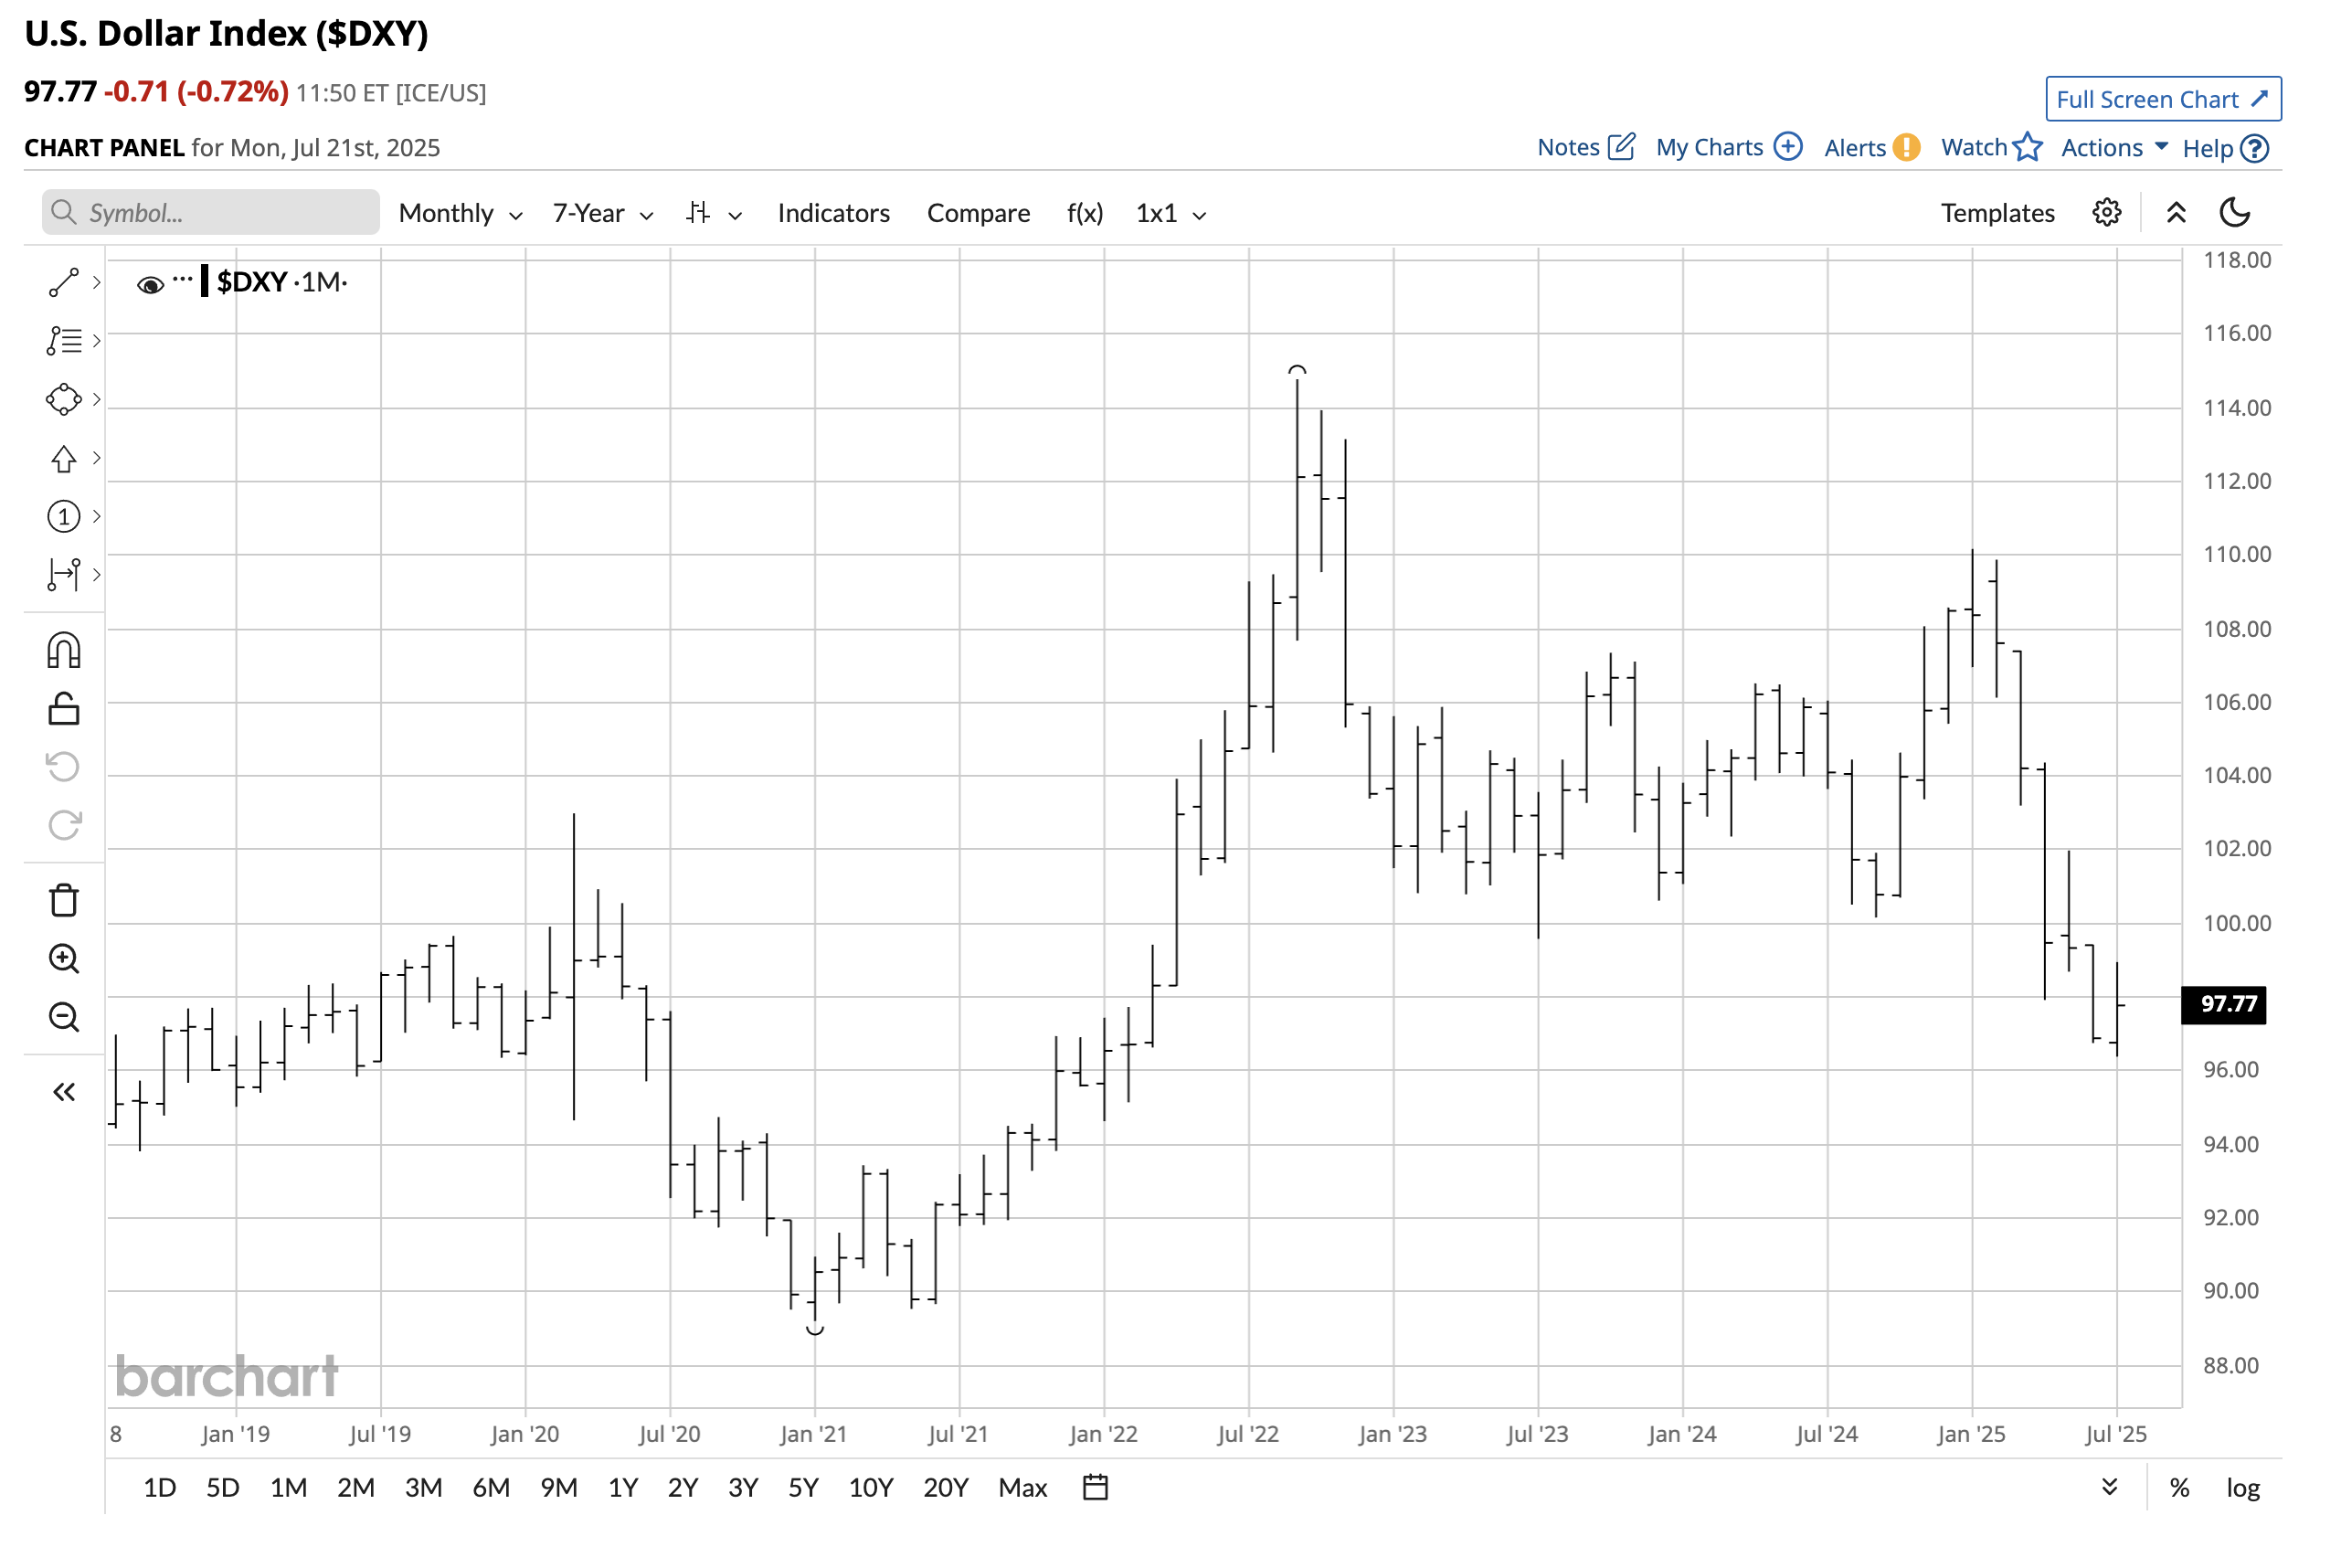
The chart highlights that after breaking under the July 2023 low of 99.58, the next critical technical support level is at the January 2021 low of 89.20. At the 98.65 level on July 15, the index remained below the July 2023 low and in a bearish trend.
Meanwhile, a challenge to the January 2021 low of 89.20 would negate the long-term bullish trend that has been in place since the 2008 low.
UDN is the bearish dollar index ETF product
The Invesco DB U.S. Dollar Index Bearish -1X Fund (UDN) is an unleveraged ETF that appreciates as the dollar index declines. At $18.75 per share, UDN had over $148.3 million in assets under management. UDN trades an average of 185,910 shares daily and charges a 0.77% management fee.
The dollar index fell 12.5% from the January 2025 high.
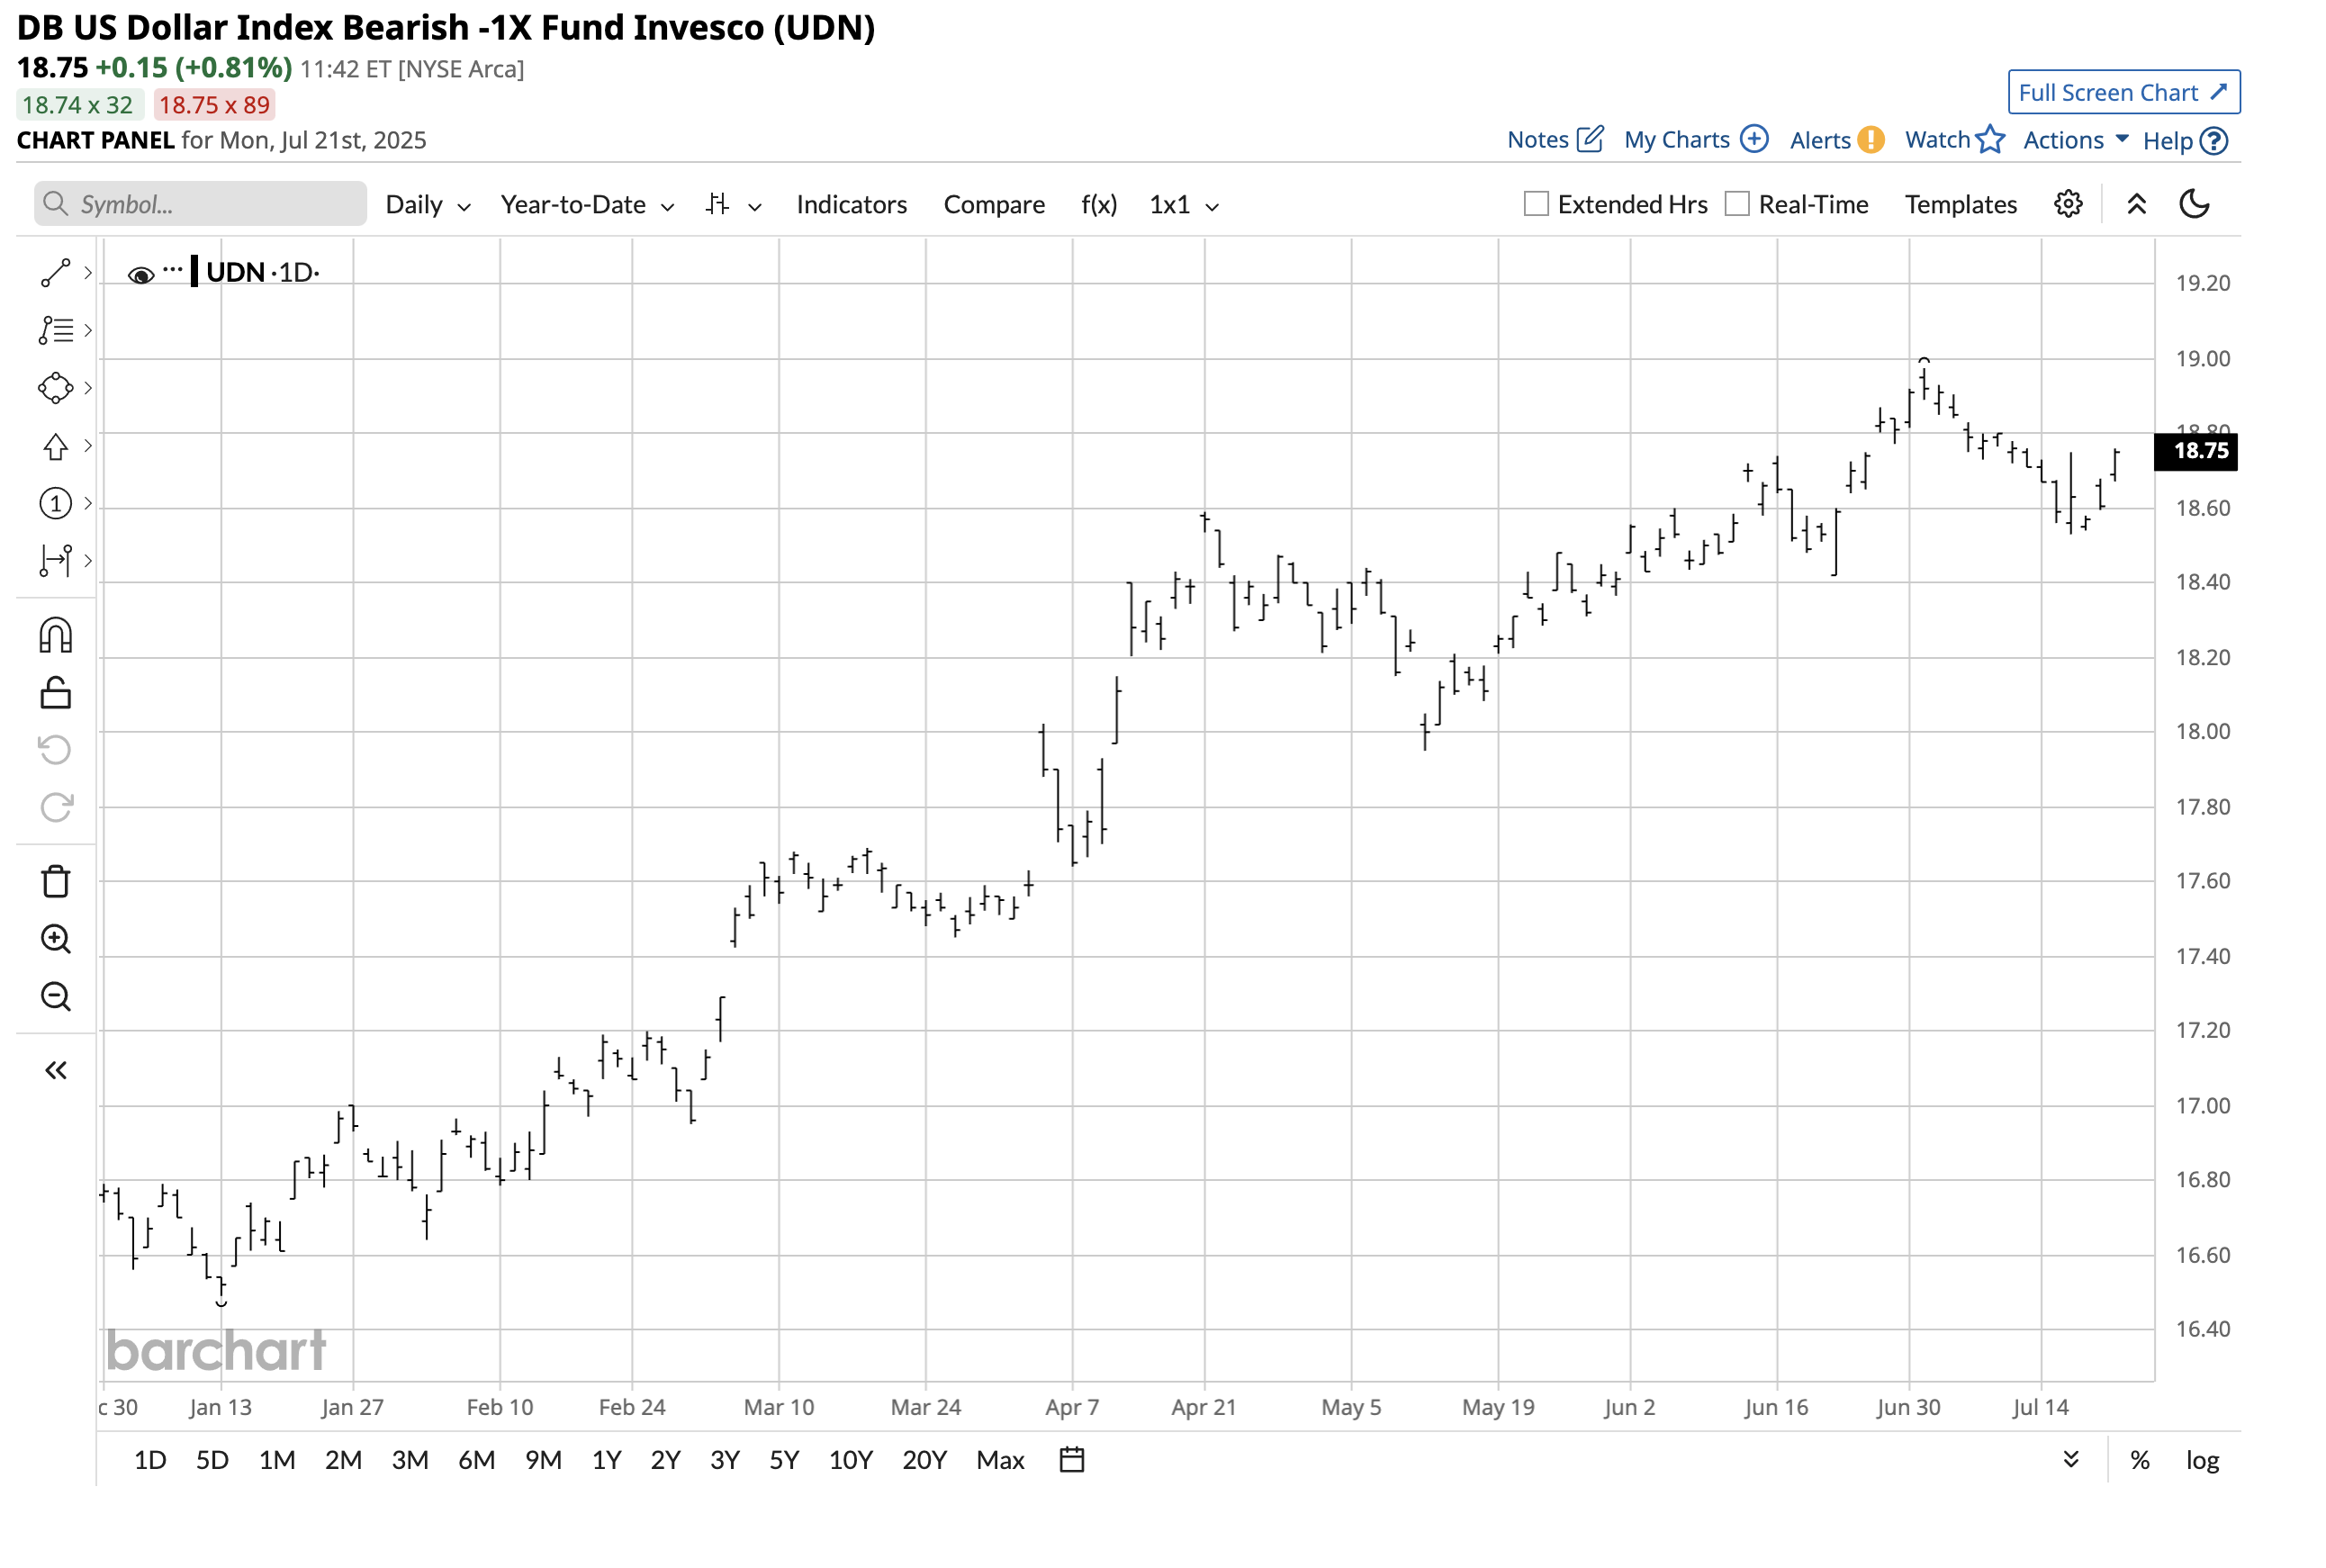
The daily chart shows that the UDN ETF appreciated 15.1%, moving from $16.49 on January 13, 2025, to $18.98 per share on July 1, 2025. UDN does an excellent job tracking the dollar index’s downside price action.
If the dollar index is heading for a challenge of the next technical support level, the UDN ETF will appreciate from the bearish ride. With lower U.S. interest rates on the horizon and a rising debt level, the dollar index’s path of least resistance remains lower in mid-July 2025, and the index has not yet found a bottom.
On the date of publication, Andrew Hecht did not have (either directly or indirectly) positions in any of the securities mentioned in this article. All information and data in this article is solely for informational purposes. For more information please view the Barchart Disclosure Policy here.
/AI%20(artificial%20intelligence)/Ai%20chip%20by%20Quality%20Stock%20Arts%20via%20Shutterstock.jpg)

/A%20hand%20holding%20a%20phone%20with%20the%20Reddit%20logo_%20Mamun_Sheikh%20via%20Shutterstock_.jpg)
/Seagate%20sign%20on%20the%20building%20atits%20operational%20headquarters%20By%20JHVEPhoto.jpeg)
/Apple%20logo%20on%20store%20front%20by%20frantic00%20via%20iStock.jpg)