UMB Financial Corp. UMBF reported first-quarter 2025 operating earnings per share of $2.58, which beat the Zacks Consensus Estimate of $2.21. The bottom line also compared favorably with $2.47 in the year-ago quarter.
The rise in net interest income (NII) and non-interest income benefited the results. Rising loan and deposit balances were other positives. However, weak asset quality and higher non-interest expense acted as spoilsports.
Net income (GAAP basis) for UMBF was $81.3 million in the first quarter, down 26.2% year over year.
UMB Financial’s Revenues & Expenses Rise
Quarterly revenues were $571.3 million, up 41% year over year. Also, the top line beat the Zacks Consensus Estimate of 2.9%.
NII on an FTE basis was $405.1 million, an increase of 64.7% from the prior-year quarter. On an FTE basis, the net interest margin (NIM) was 2.96% compared with 2.48% in the prior-year quarter.
Non-interest income was $166.2 million, up 4.4% year over year. The rise was primarily driven by an increase in trust and securities processing, service charges on deposit accounts and brokerage income.
Non-interest expenses were $384.8 million, up 51% year over year. The increase was due to a rise in salaries and bonus expenses, an increase in legal and consulting expenses, and amortization of intangibles. Operating non-interest expenses (adjusted basis) were $330.5 million, up 37% year over year.
The efficiency ratio was 65.19%, down from the prior-year quarter’s 63.44%. An increase in the efficiency ratio indicates a decrease in profitability.
UMBF’s Loans & Deposit Balances Rise
As of March 31, 2025, average loans and leases were $32.3 billion, up 27.8% sequentially. Also, average deposits increased 32.3% year over year to $50.3 billion.
UMB Financial’s Credit Quality Deteriorates
The ratio of net charge-offs to average loans was 0.45% in the reported quarter compared with 0.05% in the prior-year quarter.
Total non-accrual and restructured loans were $100.9 million compared with $17.8 million in the prior-year quarter.
The provision for credit losses was $86 million in the first quarter of 2025 compared with $10 million reported in the prior-year quarter.
UMBF’s Capital Ratios: Mixed Bag
As of March 31, 2025, the Tier 1 risk-based capital ratio was 10.35% compared with 11.09% as of March 31, 2024. The Tier 1 leverage ratio was 8.47% compared with 8.39% in the prior-year quarter. The total risk-based capital ratio was 12.54% compared with 13.03% in the year-ago quarter.
UMB Financial’s Profitability Ratios Decline
Return on average assets at the first-quarter end was 0.54%, compared with the year-ago quarter’s 1.06%.
The operating return on average common equity was 12.47% compared with 15.44% in the year-ago quarter.
Our Take on UMBF
UMB Financial benefits from revenue strength, aided by the rise in NII and non-interest income. Rising loans and deposit balances are encouraging. However, a rise in expenses and weak asset quality is concerning.
UMB Financial Corporation Price, Consensus and EPS Surprise
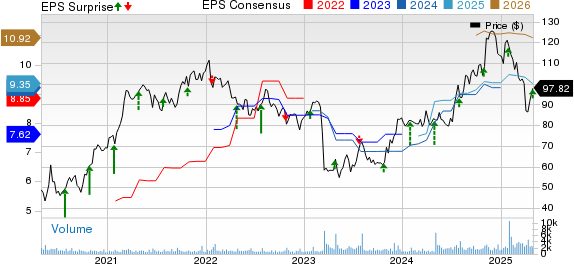
UMB Financial Corporation price-consensus-eps-surprise-chart | UMB Financial Corporation Quote
UMBF’s Zacks Rank
UMBF currently carries a Zacks Rank #4 (Sell).
You can see the complete list of today's Zacks #1 Rank (Strong Buy) stocks here.
Performance of Other Banks
Hancock Whitney Corp.’s HWC first-quarter 2025 earnings per share of $1.38 exceeded the Zacks Consensus Estimate and the year-ago figure of $1.28.
Results benefited from increased non-interest income and NII. Lower provisions were another positive. However, higher adjusted expenses alongside lower loans and deposits balances of HWC were headwinds. (Find the latest earnings estimates and surprises on Zacks Earnings Calendar.)
Bank OZK’s OZK first-quarter 2025 earnings per share of $1.47 surpassed the Zacks Consensus Estimate of $1.42. The bottom line, however, reflected a decline of 2.6% from the prior-year quarter’s actual.
Results benefited from a rise in non-interest income and lower provisions. Also, higher loans and deposit balances of OZK were other positives. However, lower NII and higher non-interest expenses were undermining factors.
Only $1 to See All Zacks' Buys and Sells
We're not kidding.
Several years ago, we shocked our members by offering them 30-day access to all our picks for the total sum of only $1. No obligation to spend another cent.
Thousands have taken advantage of this opportunity. Thousands did not - they thought there must be a catch. Yes, we do have a reason. We want you to get acquainted with our portfolio services like Surprise Trader, Stocks Under $10, Technology Innovators,and more, that closed 256 positions with double- and triple-digit gains in 2024 alone.
See Stocks Now >>Want the latest recommendations from Zacks Investment Research? Today, you can download 7 Best Stocks for the Next 30 Days. Click to get this free report
UMB Financial Corporation (UMBF): Free Stock Analysis Report
Hancock Whitney Corporation (HWC): Free Stock Analysis Report
Bank OZK (OZK): Free Stock Analysis Report
This article originally published on Zacks Investment Research (zacks.com).

/AI%20(artificial%20intelligence)/AI%20software%20engineering%20by%20Tapati%20Rinchumrus%20via%20Shutterstock.jpg)

/Netflix%20on%20tv%20with%20remote%20by%20freestocks%20via%20Unsplash.jpg)

/Apple%20Inc%20phone%20and%20data-by%20Anderson%20Reis%20via%20Shutterstock.jpg)