Corn
May
We had done a couple posts on Corn and this is another update on them,
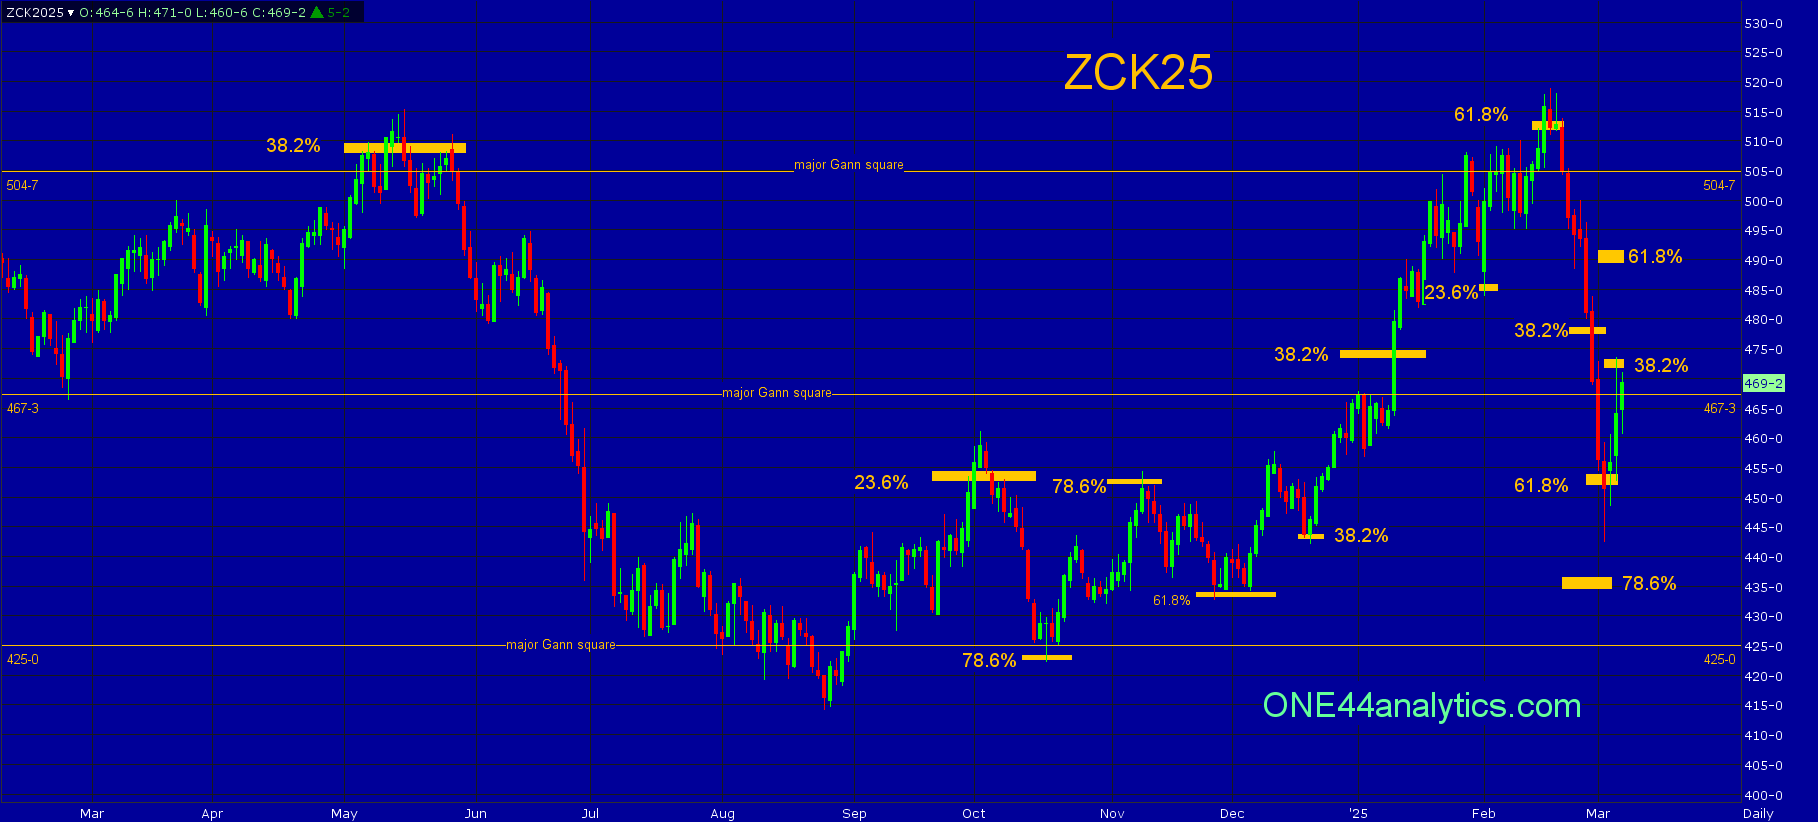
Corn Has Now Hit Key Resistance, 512.00, Update "Corn has now hit key resistance, 512.00"
Corn hit our upside target of 61.8% on 2/18/25 and this is what we gave to our Premium Members,
It has now hit 61.8% at 512.00, but has not moved from this level in any meaningful way and it will again be the key level for the next week. The Above remains the same and the Below has moved up some.
Use 512.00 as the swing point for the week again.
Above it, you still have to watch for a trade up to, or above 512.00 and a close below the 504.75 major Gann square, as this can cause a quick selloff. The short
Below it, the short term target is 38.2% back to the 8/26/24 low at 478.00, this is now the long term swing point, holding it can send quickly to a new high. With it hitting the 61.8% level at 512.00 the longer term target will be 61.8% the other way at 454.00 per the ONE44 61.8% rule.
As you can see on the chart, it traded above 512.00 and closed below the 504.75 major Gann square and the quick break followed. It is approaching the short term target at 478.00, this is also the level it needs to hold to keep the long term trend positive.
.
NOW
This week it hit the 454.00 61.8% target, it traded well below it and even had one close below, this is always acceptable but it must be right back above it the next day to remain valid. We will now use the ONE44 61.8% rule again, this time to get our next upside target.
A 61.8% level can send the market 61.8% of where it just can from and cause wide swings keeping the market in a trading range.
This gives us an upside target of 490.00.
Here is part of this week's update,
Corn completed the 61.8% (512.00) to 61.8% at 454.00, it had one slight close below it and the next day was right back above it. We will be using the ONE44 61.8% rule again for the short term target. The rally from 454.00 has already hit 38.2% back to the 2/19/25 high at 472.00 and this will be the key level for next week. Taking out 478.00 turned all the trend negative again, getting right back above 472.00 will change that back to positive.
Use 472.00 as the swing point for the week.
We have done 45 videos on how to use the Fibonacci retracements with the ONE44 rules and guidelines. These Videos are worth watching even if it is not in the market you are trading, as the ONE44 rules and guidelines are the same for every market. You will also see why we believe the Fibonacci retracements are the underlying structure of ALL markets.
ONE44 Analytics where the analysis is concise and to the point
Our goal is to not only give you actionable information, but to help you understand why we think this is happening based on pure price analysis with Fibonacci retracements, that we believe are the underlying structure of all markets and Gann squares.
If you like this type of analysis and trade the Grain/Livestock futures you can become a Premium Member.
You can also follow us on YouTube for more examples of how to use the Fibonacci retracements with the ONE44 rules and guidelines.
Sign up for our Free newsletter here.
FULL RISK DISCLOSURE: Futures trading contains substantial risk and is not for every investor. An investor could potentially lose all or more than the initial investment. Commission Rule 4.41(b)(1)(I) hypothetical or simulated performance results have certain inherent limitations. Unlike an actual performance record, simulated results do not represent actual trading. Also, since the trades have not actually been executed, the results may have under- or over-compensated for the impact, if any, of certain market factors, such as lack of liquidity. Simulated trading programs in general are also subject to the fact that they are designed with the benefit of hindsight. No representation is being made that any account will or is likely to achieve profits or losses similar to those shown. Past performance is not necessarily indicative of future results.

/Oracle%20Corp_%20office%20logo-by%20Mesut%20Dogan%20via%20iStock.jpg)
/Tesla%20Inc%20tesla%20by-%20Iv-olga%20via%20Shutterstock.jpg)
/Microsoft%20sign%20at%20the%20headquarters%20by%20VDB%20Photos%20via%20Shutterstock.jpg)