Why Ethereum Has Been Stuck Between Fear and Fed Policy
Ethereum's recent price action has been driven less by anything happening on-chain and more by what is happening in Washington and the Middle East. The Federal Reserve held its benchmark rate at 3.50 percent to 3.75 percent on June 17, 2026, the fourth consecutive hold and the first meeting led by new Chair Kevin Warsh. The statement removed previous language referencing progress toward the 2 percent inflation target, and two voting members publicly floated the idea that rate cuts once expected in the third quarter of 2026 could now slip into 2027. That hawkish repricing sent the 10 year Treasury yield climbing toward 4.82 percent in a matter of days, raising the opportunity cost of holding non yielding assets like ETH and BTC.
Layered on top of that has been a steady drain of capital from crypto investment vehicles. Spot Ethereum ETFs recorded roughly 168 million dollars in outflows in a single week in early June, part of an 880 million dollar four week withdrawal streak, while spot Bitcoin ETFs saw their largest weekly outflow on record at 3.4 billion dollars. Much of this institutional retreat has coincided with the broader U.S. Iran tension, where progress in negotiations briefly pushed crude oil from gains into losses and lifted risk appetite, only for renewed Fed hawkishness to undercut that relief. The Crypto Fear and Greed Index has hovered near the low twenties, in extreme fear territory, reflecting how sensitive sentiment has become to each new headline out of the Fed or the Treasury market.
On the regulatory side, the Senate Banking Committee's advance of the CLARITY Act in mid May offered a longer term positive for digital asset market structure, but the market reaction showed that policy progress cannot offset short term ETF outflows and rising real yields. Ethereum specific catalysts have taken a back seat for now, with the long anticipated Glamsterdam upgrade still pending testnet completion and not yet a near term price driver.
What the Market Has Done
- Ethereum gapped down and broke below auction block 1 in February, setting the tone for the year.
- The market then traded mostly sideways from February through May, slowly grinding back up toward the February gap low.
- Sellers stepped in to defend that gap low, an area that was confluent with the yearly VWAP, a confluence that ultimately rejected the recovery attempt.
- That rejection triggered a rotation back down toward the 1500 area, daily level 2, a long standing support zone dating back to 2023.
- Sellers have since stepped their offers down to 1854, a minor level, and price has been compressing between that level and 1500.
- This compression has unfolded against the backdrop of the broader risk off tone described above, with ETH price action mirroring the same Fed driven yield pressure hitting Bitcoin and equities, even as the specific technical structure has remained Ethereum's own story.
What to Expect in the Coming Weeks
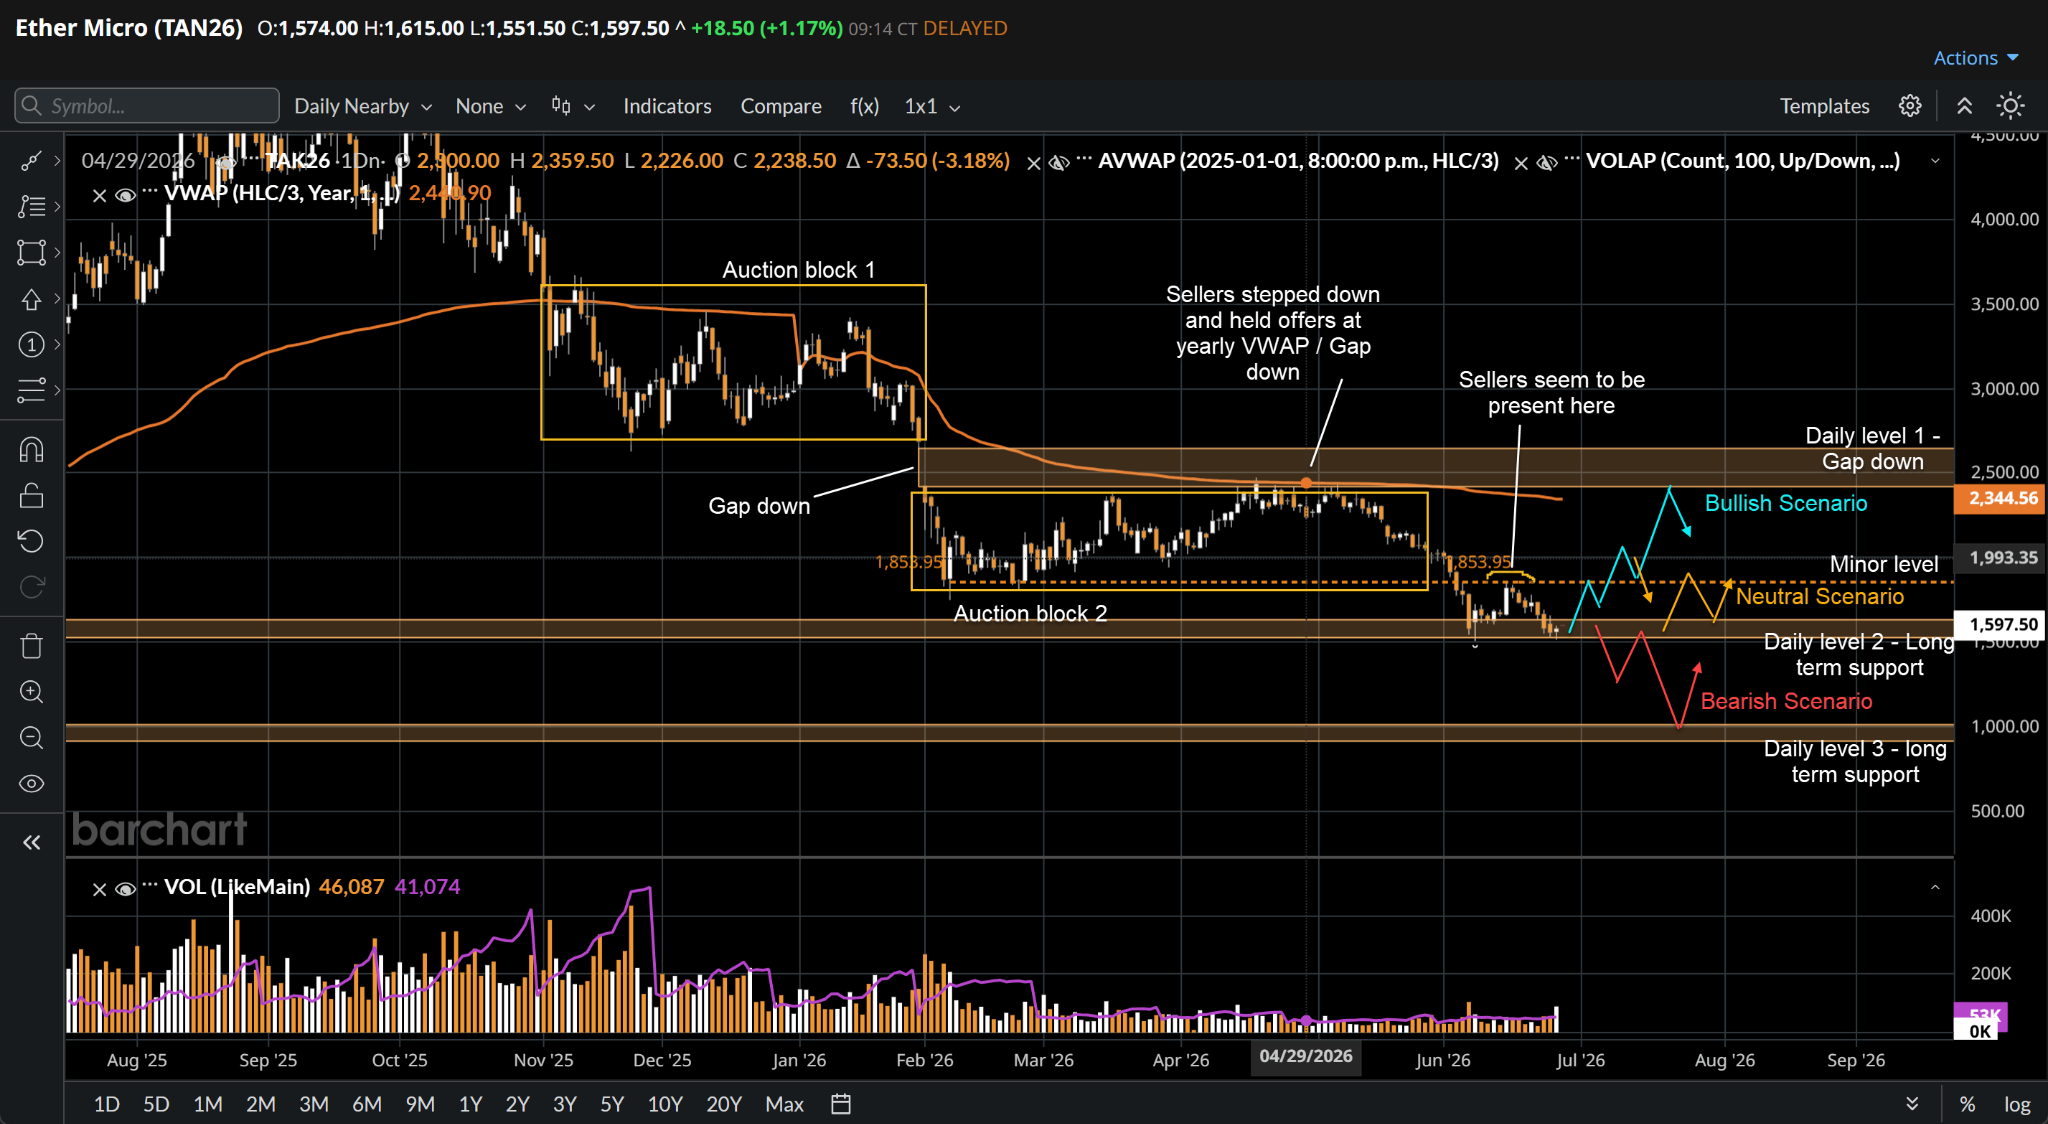
The key levels to watch remain 1500, daily level 2, and 1854, the minor level capping recent rallies.
Bearish Scenario:
- If sellers hold firm at 1854 and continue to reject upside attempts, expect a breakdown below 1500 with a move toward the 1000 area, daily level 3, a long term support from 2022.
- This scenario would likely be triggered by a further hawkish surprise from the Fed, such as confirmation that rate cuts are pushed into 2027.
- It could also be triggered by a fresh escalation in U.S. Iran tensions that reignites the flight from risk assets and accelerates ETF outflows.
Neutral Scenario:
- Expect continued two way, tight compression between 1854 and 1500 as the market awaits a clearer directional catalyst.
- This would likely persist if upcoming inflation data, such as core PCE, comes in roughly in line with expectations.
- It would also persist if the Fed avoids any major surprise, leaving traders to chop within the range.
Bullish Scenario:
- If buyers reclaim and hold above 1854, expect a move back up through auction block 2 toward the 2400 area, where responsive selling can be expected.
- A plausible trigger would be a softer than expected inflation print combined with signs that ETF outflows are stabilizing.
- A dovish pivot from the Fed that eases pressure on Treasury yields and revives risk appetite could also serve as a trigger.
Conclusion
Ethereum's technical structure is telling a clear story of compression, with 1500 and 1854 acting as the two walls that will decide whether the next move is a breakdown toward 1000 or a reclaim toward 2400. But that technical resolution will almost certainly be triggered by forces outside the chart itself. The Fed's posture under Kevin Warsh, the trajectory of Treasury yields, the path of U.S. Iran relations, and the pace of ETF outflows are all macro variables that have dictated Ethereum's range bound behavior over the past month, and they are likely to remain the deciding factors in the weeks ahead. For traders, the lesson is to respect the levels while keeping one eye on the macro calendar, since the breakout, whichever direction it comes, is unlikely to happen in a vacuum. Where do you think Ethereum breaks first, and what headline do you think gets it there?
We believe that professional growth is impossible without the truth found in your own data. Our presence on Barchart bridges the gap between complex exchange data and professional execution. Open an Account and access the tools you need to see your performance clearly.
Disclaimer:
This article is provided for informational and educational purposes only and does not constitute financial, investment, or trading advice. The analysis presented reflects the author’s market observations and opinions at the time of writing and is not a recommendation to buy or sell any futures contract, security, or financial instrument. Futures trading involves significant risk and is not suitable for all market participants. Losses may exceed initial margin deposits, and market conditions can change rapidly.
Any scenarios, levels, or market expectations discussed are hypothetical in nature and are intended solely to illustrate potential market behavior. They do not represent actual trading results and should not be interpreted as guarantees of future performance. Past performance, market behavior, or historical price action are not indicative of future outcomes.
Readers are solely responsible for their own trading decisions and risk management. Always conduct independent research, consider your financial situation and risk tolerance, and consult with a qualified financial professional, if necessary, before engaging in futures or derivatives trading.
/AI%20(artificial%20intelligence)/Ai%20chip%20by%20Quality%20Stock%20Arts%20via%20Shutterstock.jpg)

/A%20hand%20holding%20a%20phone%20with%20the%20Reddit%20logo_%20Mamun_Sheikh%20via%20Shutterstock_.jpg)
/Seagate%20sign%20on%20the%20building%20atits%20operational%20headquarters%20By%20JHVEPhoto.jpeg)
/Apple%20logo%20on%20store%20front%20by%20frantic00%20via%20iStock.jpg)