In yesterday’s analysis, I wrote the following about the USD Index’s breakout:
It’s a breakout. The USDX moved above the short-term, declining resistance line, which is a bullish sign.
This line, along with the rising support line based on the very recent lows, create a vertex that is likely to mark some kind of turnaround. Either a local top or a quick decline to the previously broken line that would – most likely – verify the breakout.
This means that PMs and miners could decline in the very near term and then move higher in a rather insignificant way – perhaps another re-test of the February lows that would then be followed by a decline to fresh short-term lows.
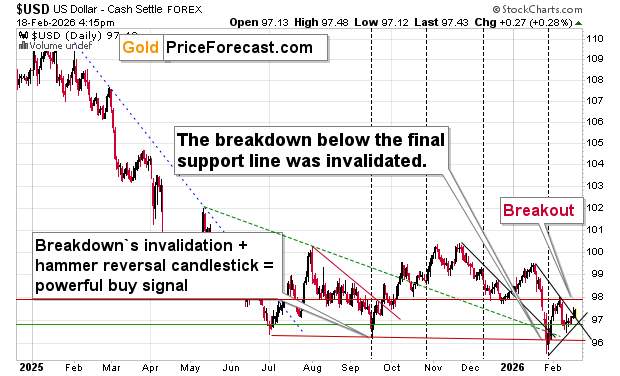
The USD Index declined today, but it didn’t move below the previously broken resistance line, which now serves as support.
That’s in perfect tune with what I wrote yesterday (the part that I put in bold).
The same goes for today’s insignificant move higher in the precious metals sector.
In yesterday’s analysis, in order to provide you with an additional angle on the current situation, I analyzed gold and silver in terms of the euro. Today, I’d also like to feature something that doesn’t get enough coverage – the intermarket patterns that cover not just the precious metals, but also copper, stocks, and USD.
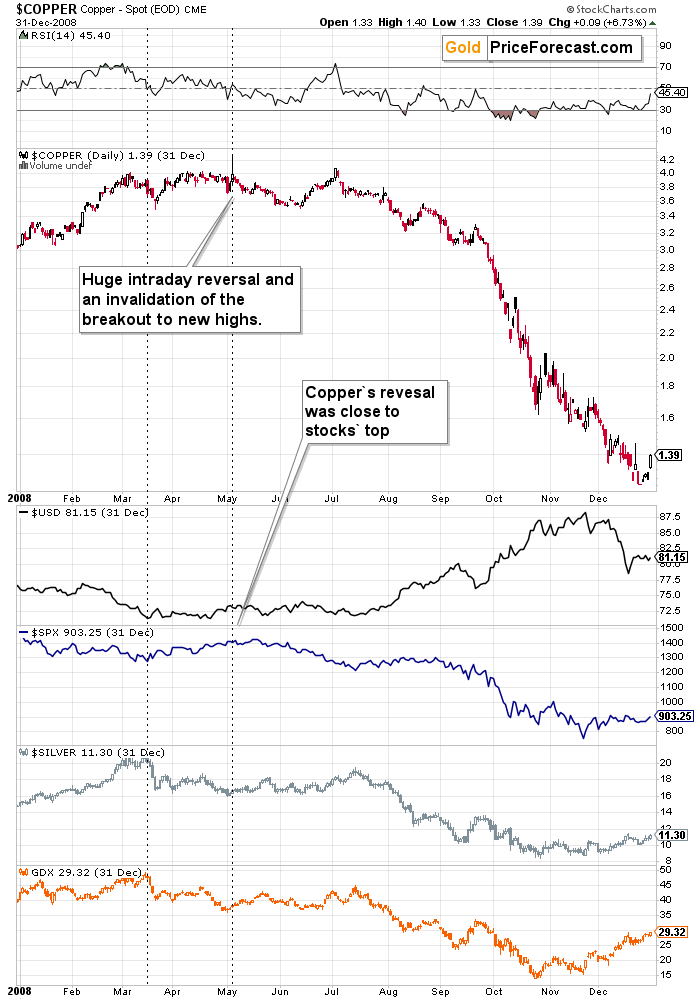
The above chart shows what happened in 2008 in the above-mentioned markets. The important details are copper’s clear reversal and the invalidation of its breakout to new highs.
The additional details are:
- USD’s bottom aligned with gold’s and silver’s tops
- Copper’s top aligned – approximately – with stocks’ top (one thereof)
And here’s what we see right now and what we saw recently in those markets.
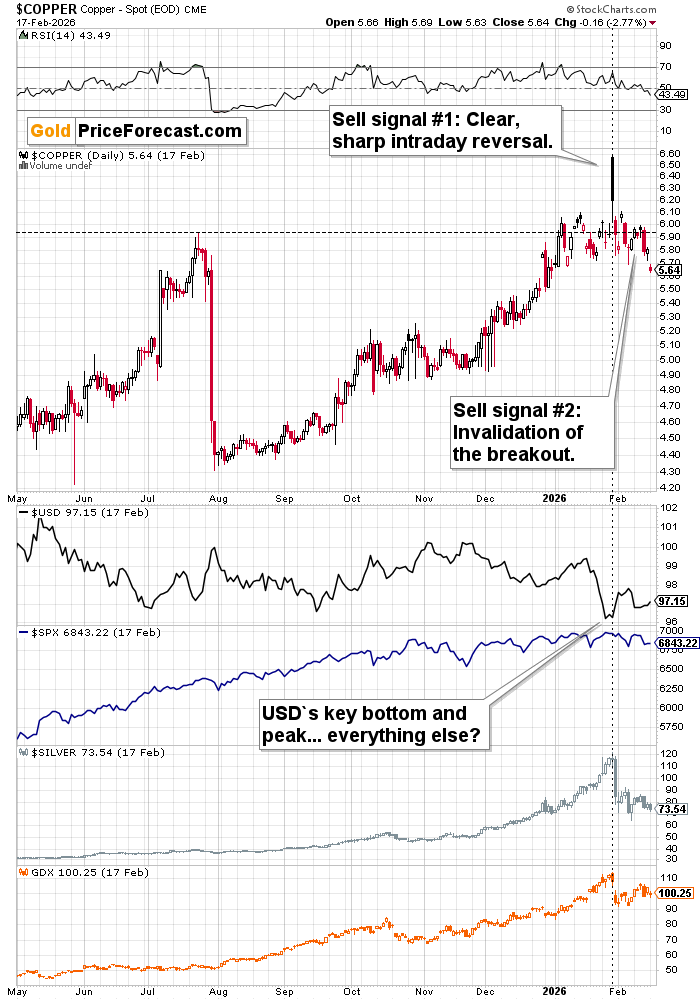
Both above points happened at the same time just a few weeks ago.
The USD Index formed a major bottom while stocks topped. Gold, silver, and copper reversed at that time as well.
What’s very interesting – to say the least – from the technical point of view is that copper reversed and invalidated its breakout just like it did at its 2008 top.
Copper’s reversal and invalidation are sell signals on their own but when we consider that this is happening just like it happened in 2008 while USD, stocks and precious metals are also behaving similarly, we get a picture that’s not just slightly bearish, but very much so.
And the similarity to happened after the 2011 only adds to it.
Thank you for reading my today’s free analysis. I’ll continue to send you occasional updates and, as always, I’ll keep my subscribers informed at all times.
If enjoyed it and would like to get the follow-ups, I encourage you to sign up for my free gold newsletter today.
Thank you.
Przemyslaw K. Radomski, CFA
Founder
Golden Meadow®

/AI%20(artificial%20intelligence)/AI%20microchip%20by%20DesignKingBD360%20via%20Shutterstock.jpg)
/2d%20illustration%20of%20Cloud%20computing%20by%20Blackboard%20via%20Shutterstock.jpg)

/Nvidia%20logo%20and%20sign%20on%20headquarters%20by%20Michael%20Vi%20via%20Shutterstock.jpg)