Wheat
The short of it,
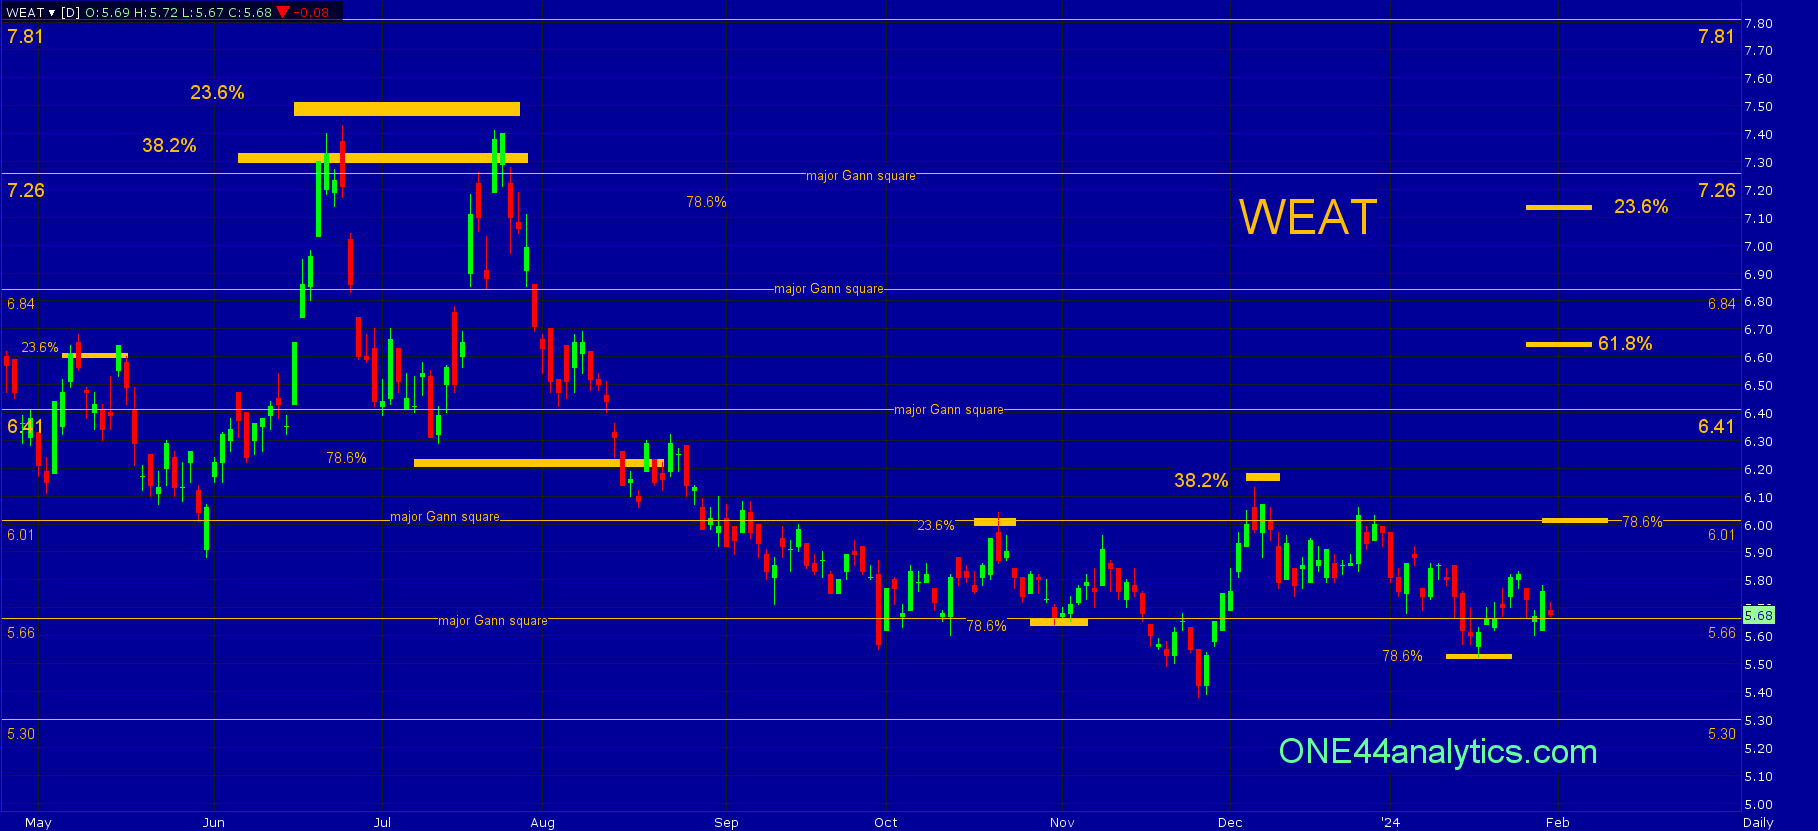
Use 5.55 as the swing point for now.
Above it, the short term target is 6.00, longer term look for 6.65.
Below it, look for 5.30 to start.
Here is why,
Since the 2022 high in Wheat and the WEAT ETF each of the attempts to rally have been stopped by key Fibonacci retracements. The 38.2% retracement tells us staying below it keeps the trend intact and the 23.6% level tells us the market is extremely weak.
The high in June and then again in July of last year stopped not only at 38.2% back to the 10/10/22 high, but also 23.6% back to the high made in 2022, this area was 7.30 to 7.45. The setback from this area eventually sent to new lows as would normally be expected from these retracements.
The next rally after making new lows in November of last year took it right to 38.2% on 12/6/23. It has yet to make a new low to keep the trend intact, however it has hit a 78.6% retracement. As the ONE44 78.6% rule says, any failure to make a new low after hitting a 38.2%, or 23.6% retracement in the area of a 78.6% retracement can be the start of the next Bull more, or at least send it 78.6% of where it just came from. The short term target on a rally from 5.55 is 6.00 (78.6%) this is also a major Gann square.
Here is our latest video on how to use the Fibonacci retracements with the ONE44 rules and guidelines.
A Classic Fibonacci Reversal In The Market And How To Spot It.
ONE44 Analytics where the analysis is concise and to the point
Our goal is to not only give you actionable information, but to help you understand why we think this is happening based on pure price analysis with Fibonacci retracements, that we believe are the underlying structure of all markets and Gann squares.
If you like this type of analysis and trade the Grain/Livestock futures you can become a Premium Member.
You can also follow us on YouTube for more examples of how to use the Fibonacci retracements with the ONE44 rules and guidelines.
Sign up for our Free newsletter here.
FULL RISK DISCLOSURE: Futures trading contains substantial risk and is not for every investor. An investor could potentially lose all or more than the initial investment. Commission Rule 4.41(b)(1)(I) hypothetical or simulated performance results have certain inherent limitations. Unlike an actual performance record, simulated results do not represent actual trading. Also, since the trades have not actually been executed, the results may have under- or over-compensated for the impact, if any, of certain market factors, such as lack of liquidity. Simulated trading programs in general are also subject to the fact that they are designed with the benefit of hindsight. No representation is being made that any account will or is likely to achieve profits or losses similar to those shown. Past performance is not necessarily indicative of future results.
On the date of publication, Nick Ehrenberg did not have (either directly or indirectly) positions in any of the securities mentioned in this article. All information and data in this article is solely for informational purposes. For more information please view the Barchart Disclosure Policy here.

/AI%20(artificial%20intelligence)/Businessman%20touching%20the%20brain%20working%20of%20Artificial%20Intelligence%20(AI)%20Automation%20by%20Suttiphong%20Chandaeng%20via%20Shutterstock.jpg)
/Intel%20Corp_%20Santa%20Clara%20campus-by%20jejim%20via%20Shutterstock.jpg)
/EV%20in%20showroom%20by%20Robert%20Way%20via%20Shutterstock.jpg)