Dual Edge Research publishes two powerful newsletters that work great individually — and even better together. The Bull Strangle Newsletter focuses on stocks and options, combining stock ownership with premium-selling strategies to generate consistent income and market-beating returns. The Smart Spreads Newsletter specializes in seasonal commodity futures spreads, offering a diversified approach with low correlation to equities. Together, they deliver a complete investment perspective — one focused on income, the other on diversification — all under one simple subscription.
Introduction
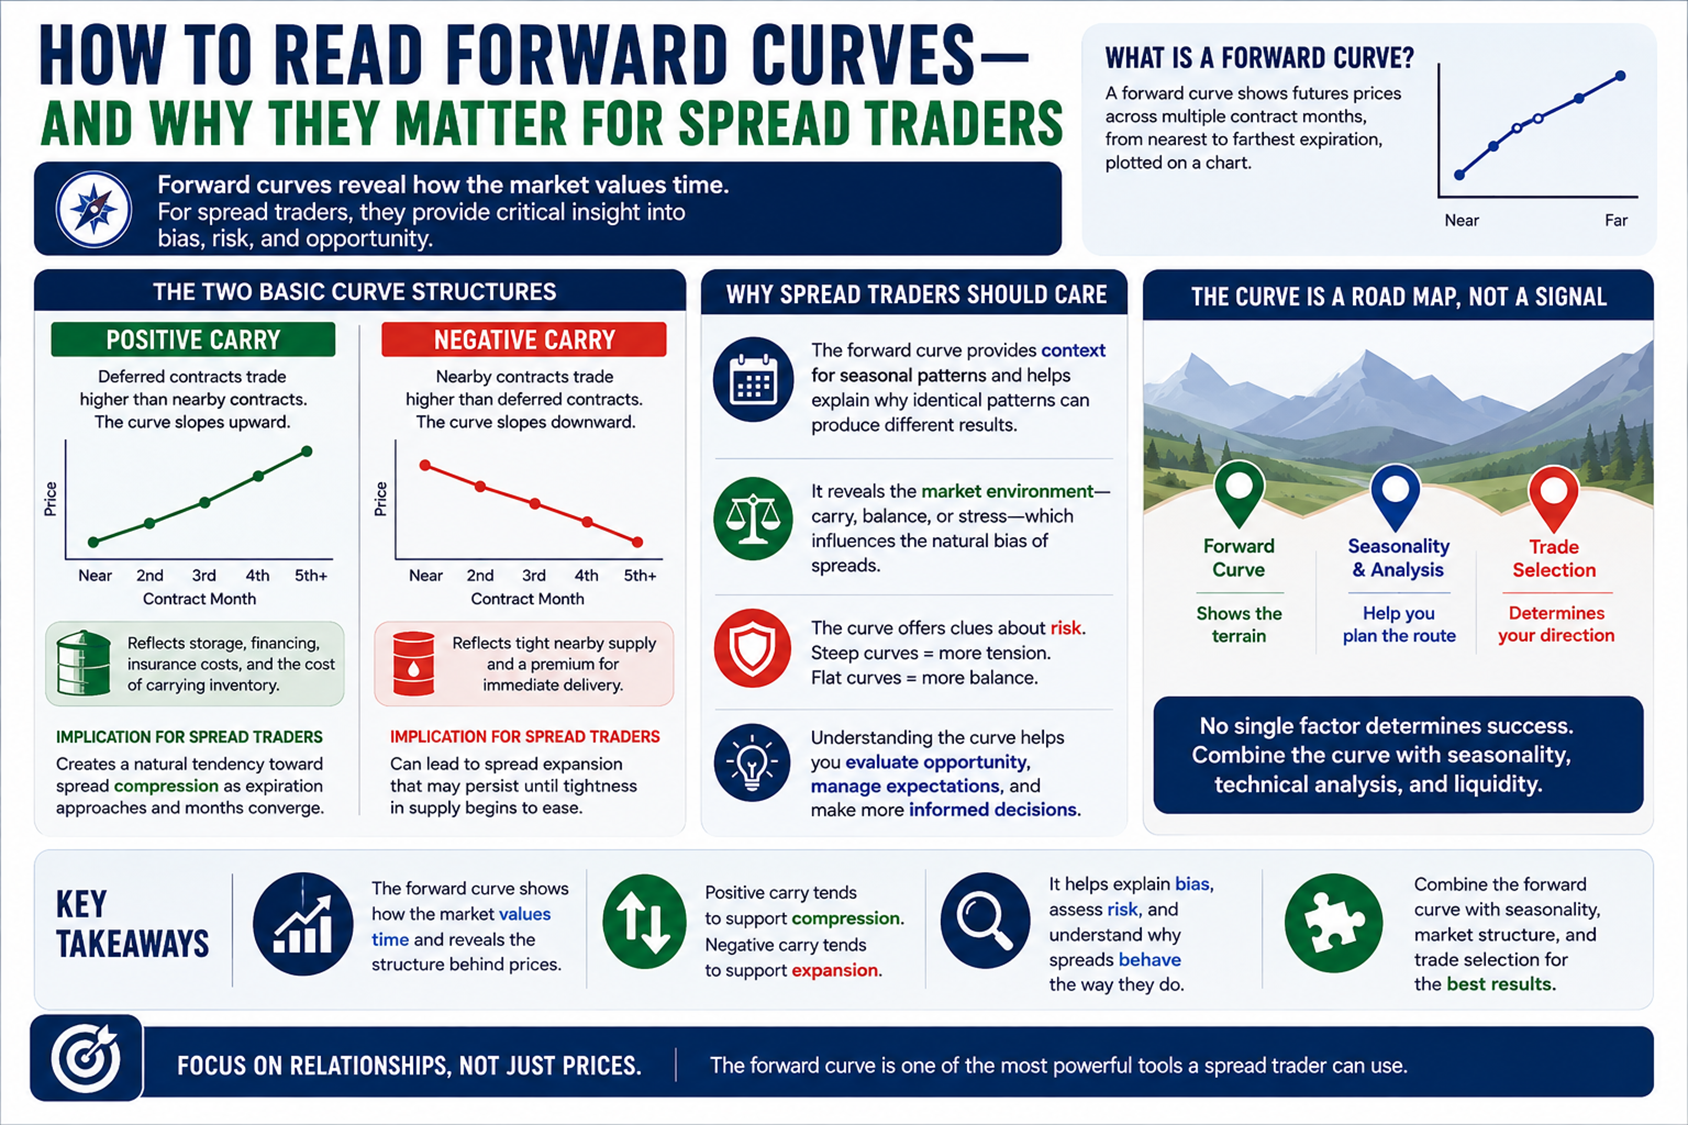
Most traders spend their time analyzing charts. Spread traders should spend more time analyzing forward curves. While outright traders focus on the price of a single futures contract, spread traders trade the relationship between contracts. The structure of the forward curve heavily influences that relationship. Understanding how to read a forward curve can provide valuable insight into why spreads behave the way they do, why some trades have a natural tendency to move in your favor, and why others require much more precision and timing. In many cases, the forward curve reveals more about a spread's potential than the price chart itself.
What Is a Forward Curve?
A forward curve is simply a snapshot of futures prices across multiple contract months. Imagine lining up every futures contract for a market—from the nearest expiration to contracts several years into the future—and plotting their prices on a chart. The resulting line is the forward curve. For example, a crude oil forward curve might display prices for:
- July Crude Oil
- August Crude Oil
- September Crude Oil
- October Crude Oil
- November Crude Oil
and so on. The shape of that curve tells traders how the market values future delivery relative to nearby delivery. For spread traders, that shape is often more important than the outright price itself.
The Two Basic Curve Structures
Most forward curves fall into one of two broad categories.
- Positive Carry Markets - In positive carry markets, deferred contracts trade at higher prices than nearby contracts. The curve slopes upward as you move further into the future. This structure often reflects storage, financing, and insurance costs, as well as the economic reality of carrying inventory over time. Many agricultural and financial futures markets spend much of their time in this type of structure... For spread traders, positive carry creates a natural tendency toward spread compression. The premium embedded in deferred contracts slowly erodes as expiration approaches and contracts move closer together in time. This tendency can become an important source of edge.
- Negative Carry Markets - Negative carry markets display the opposite structure. Nearby contracts trade at higher prices than deferred contracts. The curve slopes downward. This typically occurs when the immediate supply is tight relative to demand, creating a premium for prompt delivery. Energy markets frequently exhibit this structure during periods of supply stress. Negative carry markets often create conditions where spread expansion can persist much longer than traders expect. The nearby premium must remain supported by ongoing supply tightness. When those conditions change, the spread can reverse quickly.
Why Spread Traders Should Care
Many beginning spread traders focus exclusively on seasonality. Seasonal patterns can be powerful, but they represent only one piece of the puzzle. The forward curve provides important information about the environment in which the seasonal pattern operates.
Consider two seasonal trades with identical historical performance. One occurs in a market exhibiting strong positive carry. The other occurs in a market exhibiting strong negative carry. Although the seasonal pattern may look identical, the underlying structural forces are very different. One trade may have a natural tailwind from carry. The other may require specific market conditions to remain favorable. Understanding that distinction helps traders better evaluate both opportunity and risk.
What the Curve Says About Risk
One of the biggest misconceptions among newer spread traders is that all calendar spreads carry similar risk characteristics. They do not. The forward curve often provides clues about the amount of structural tension embedded in a market. Steep curves frequently indicate stronger underlying forces at work. Flat curves often indicate a more balanced supply-and-demand environment. Neither is automatically bullish or bearish for a spread trader. However, the curve can help explain why some spreads experience smooth, gradual moves while others produce sharp, volatile swings. The shape of the curve often reflects the market's underlying stress level.
The Curve Is a Road Map, Not a Signal
A common mistake is treating the forward curve as a trading signal. The curve itself does not tell traders what to buy or sell. Instead, it provides context. Think of the forward curve as a road map. It shows the terrain. Seasonality, technical analysis, and trade selection determine which direction you choose to travel. The most successful spread traders combine all of these pieces. They evaluate historical patterns, current market structure, liquidity, and forward curve behavior before selecting a trade. No single factor determines success. But ignoring the forward curve means ignoring one of the most important drivers of spread performance.
Bringing It All Together
The forward curve is far more than a collection of futures prices. It is a visual representation of how a market values time. For spread traders, that information can be incredibly valuable. The curve helps explain why certain spreads naturally compress, why others expand, and why identical seasonal patterns can produce very different outcomes depending on the market environment.
Most traders focus on price. Spread traders should focus on relationships. And few tools reveal those relationships more clearly than the forward curve.
Looking Ahead
Understanding the forward curve is the first step. The next step is understanding how that structure directly impacts trade selection. In a future article, we'll examine how positive carry, negative carry, direction, and leg selection interact to create dramatically different performance profiles across commodity spread markets.
More Information
Now you can get two powerful newsletters — for one simple price!
- For stocks and options, the Bull Strangle Newsletter shows you how to combine stock ownership with dual option selling — a disciplined strategy that has consistently outperformed the S&P 500.
- For commodity futures, the Smart Spreads Newsletter focuses on seasonal commodity spreads — a proven, low-correlation approach that thrives in all types of markets.
Each newsletter is designed to deliver consistent income on its own — but when used together, they create a complete, diversified trading approach that works in any market environment.
Visit BullStrangle.com to subscribe for just $1 for the first month.
For a video overview of the Bull Strangle Newsletter
For a video overview of the Smart Spreads Newsletter
Darren Carlat
Dual Edge Research
(214) 636-3133
DualEdgeResearch@gamil.com
Disclaimer
This information is for informational purposes only and should not be considered as investment advice. Past performance is not indicative of future results, and all investments carry inherent risk. Consult with a financial advisor before making any investment decisions.
/AI%20(artificial%20intelligence)/AI%20technology%20concept%20by%20NMStudio789%20via%20Shutterstock.jpg)


/Space/Planet%20earth%20with%20flying%20rocket%20by%20Sergey%20Mironov%20via%20Shutterstock.jpg)
/Sign%20of%20Intel%20at%20entrance%20%20by%20michaelmond.jpeg)