/AI%20(artificial%20intelligence)/Ai%20chip%20by%20Quality%20Stock%20Arts%20via%20Shutterstock.jpg)
We’re just going to cut straight past the polite talk and tell it how it is: Tempus AI (TEM) is a real stinker. Currently ranked as an 88% Strong Sell by the Barchart Technical Opinion indicator, rampant concerns exist that TEM stock may continue its downward ascent. That would be bad news considering the security has already lost roughly 26% on a year-to-date basis.
Still, with a 60-month beta of 3.99, TEM stock is effectively four times more volatile than the benchmark S&P 500. Beyond that, investors have grown extremely skeptical about the artificial intelligence play that’s designed to bring healthcare into a new golden digital age.
Essentially, Tempus is attempting to build an AI operating system for healthcare, centered around massive amounts of clinical and genomic data. Breaking down the elements, the business commands three major pillars:
- Genomic testing and diagnostics
- AI software and clinical tools
- Data monetization for pharmaceutical and biotech companies
In many ways, Tempus seeks to deliver a data flywheel to advance the precision medicine industry. While that sounds innovative, investors have begun to question the previous rich premium that TEM stock carried. It’s quite possible that hospitals may build their own data systems or that larger healthcare entities play catch-up. Also, AI could commoditize the underlying analytics, creating a relevancy problem.
Down the line, investors have begun worrying whether Tempus will have a differentiation value or if the crux of the business will focus on distribution and reimbursement controls. Obviously, there’s mass potential here but significant risks, thus leading to severe choppiness in TEM stock.
However, these are longer-term concerns. For those seeking a quick scalp, Tempus AI could be an intriguing candidate.
Volatility Skew Throws a Wrench into TEM Stock
Given how volatile Tempus AI stock is, the natural reaction that the general public would likely have regarding smart money risk management is to protect against a further collapse of market value. However, the volatility skew tells a different tale, one that prioritizes upside exposure.
By definition, the volatility skew identifies implied volatility (IV) across the strike price spectrum of a given options chain. Since IV reflects the kinetic potential of a security, a higher IV implies greater demand for the strike in question. Subsequently, areas of elevated volatility readings suggest that traders are effectively bidding up insurance against the underlying implied movement.
And really, that’s what the skew represents — an insurance market. With TEM stock, options traders are sending a rather clear signal: they’re more afraid of missing out on a potential rally than they are in protecting against a calamitous loss.
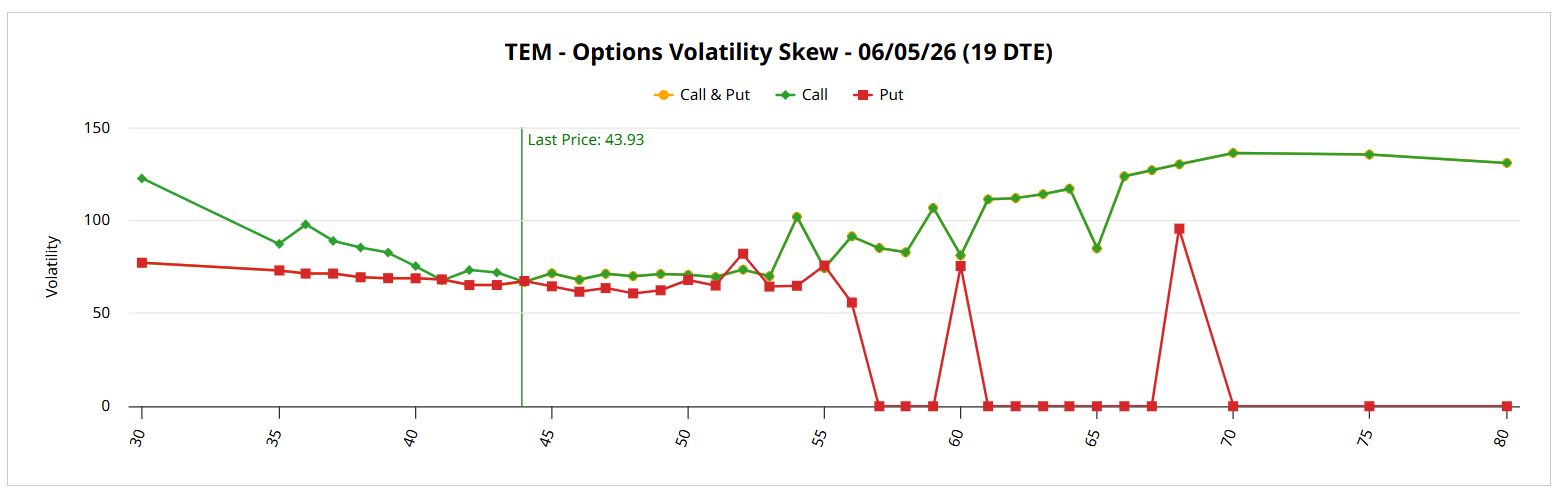
Don’t get me wrong — the smart money is protecting its hind end. However, the skew for the June 5 expiration date shows call IV dominating proceedings over put IV in the lower strike price boundaries. Moreover, if sophisticated market participants genuinely anticipated a collapse, put IV should swing violently higher across the out-the-money (OTM) strikes.
Instead, put IV is relatively flat the further down you go in the strike price range. There’s downside risk protection going on but it’s hardly abnormal relative to standard baseline volatility readings. Plus, on the OTM call side, the tail is much longer. Taken as a whole, the smart money appears to be anticipating a near-term bounce back.
It’s not an unreasonable assertion because of the ebb and flow of popular securities. On Friday, TEM stock lost 3.41%. Over the past five sessions, it slipped 11.11%. And in the trailing month, it gave up 21.37%.
The idea here is that the smart money probably believes TEM stock is “due.” With a little inductive magic, we can try to pinpoint where it might land.
Trading by the Numbers
If we grant ourselves the presupposition that beaten-up stocks have a good chance of temporary recovery due to most of the bad news being baked in, we can try to time our trade in TEM stock based on prior conditioned observations. As stated earlier, TEM has a beta of 3.99 but that’s an aggregate metric. We’re really interested in how TEM would trade given a specific condition.
Interestingly, in the past 10 weeks, Tempus AI stock only printed three up weeks, thereby leading to a downward slope across the period. Under this specific framework or sequence, TEM would be expected to range between $36 and $60 over the next 10 weeks (assuming a starting price of $43.93). However, from a sequential week-to-week view, the median pathway would likely be incredibly choppy.
Nevertheless, it has been observed that, over the next four weeks, TEM has demonstrated a tendency of clustering around $50 to $55 (again, assuming a starting price of $43.93). If that outcome were to happen again, the one trade that looks awfully tempting is the 48/50 bull call spread expiring June 5.
If the $50 strike is triggered at expiration, you’re looking at a payout of nearly 251% — and that’s with a net debit of $57 per spread.
Of course, inductive methodologies aren’t foolproof, far from it. But in a non-deterministic system, it’s probably the best tool we have to help even the odds.
On the date of publication, Josh Enomoto did not have (either directly or indirectly) positions in any of the securities mentioned in this article. All information and data in this article is solely for informational purposes. For more information please view the Barchart Disclosure Policy here.
/An%20Intel%20sign%20out%20front%20of%20a%20corporate%20office%20by%20wolterke%20via%20Adobe%20Stock.jpeg)


/United%20Parcel%20Service%2C%20Inc_%20logo%20on%20truck-by%20100pk%20via%20iStock.jpg)
/A%20close-up%20of%20the%20SpaceX%20sign%20on%20a%20black%20building%20by%20IanDewarPhotography%20via%20Adobe%20Stock.jpeg)