- JD.com (JD) shares broke out to a fresh 2026 high on Wednesday. That opens the door for a potentially higher run, after reporting first-quarter 2026 earnings that exceeded analyst expectations.
- The stock’s 20-day moving average has renewed its upward trend, after creating a brief base.
- The 200-day moving average turned positive about six weeks ago, and the stock has rallied more than 30% since that time.
- Still, the stock sits 25% below its late 2024 high price, implying more upside potential. If this market did not care much about momentum, JD would be a less-attractive candidate. However, the current trend is nothing but momentum, making an earnings breakout a more pronounced technical signal.
Today’s Featured Stock
Valued at $45 billion, JD.com (JD) is a leading supply chain-based technology and service provider in China, operating a massive e-commerce and logistics network. The company is currently successfully pivoting toward high-margin service revenue and international expansion to drive future growth.
What I’m Watching
I found today’s Chart of the Day by using Barchart’s powerful screening functions to sort for stocks with notably improving technicals, a combination of momentum, strength and direction. I then used Barchart’s Flipcharts feature to review the charts for timely opportunities. JD checks those boxes.
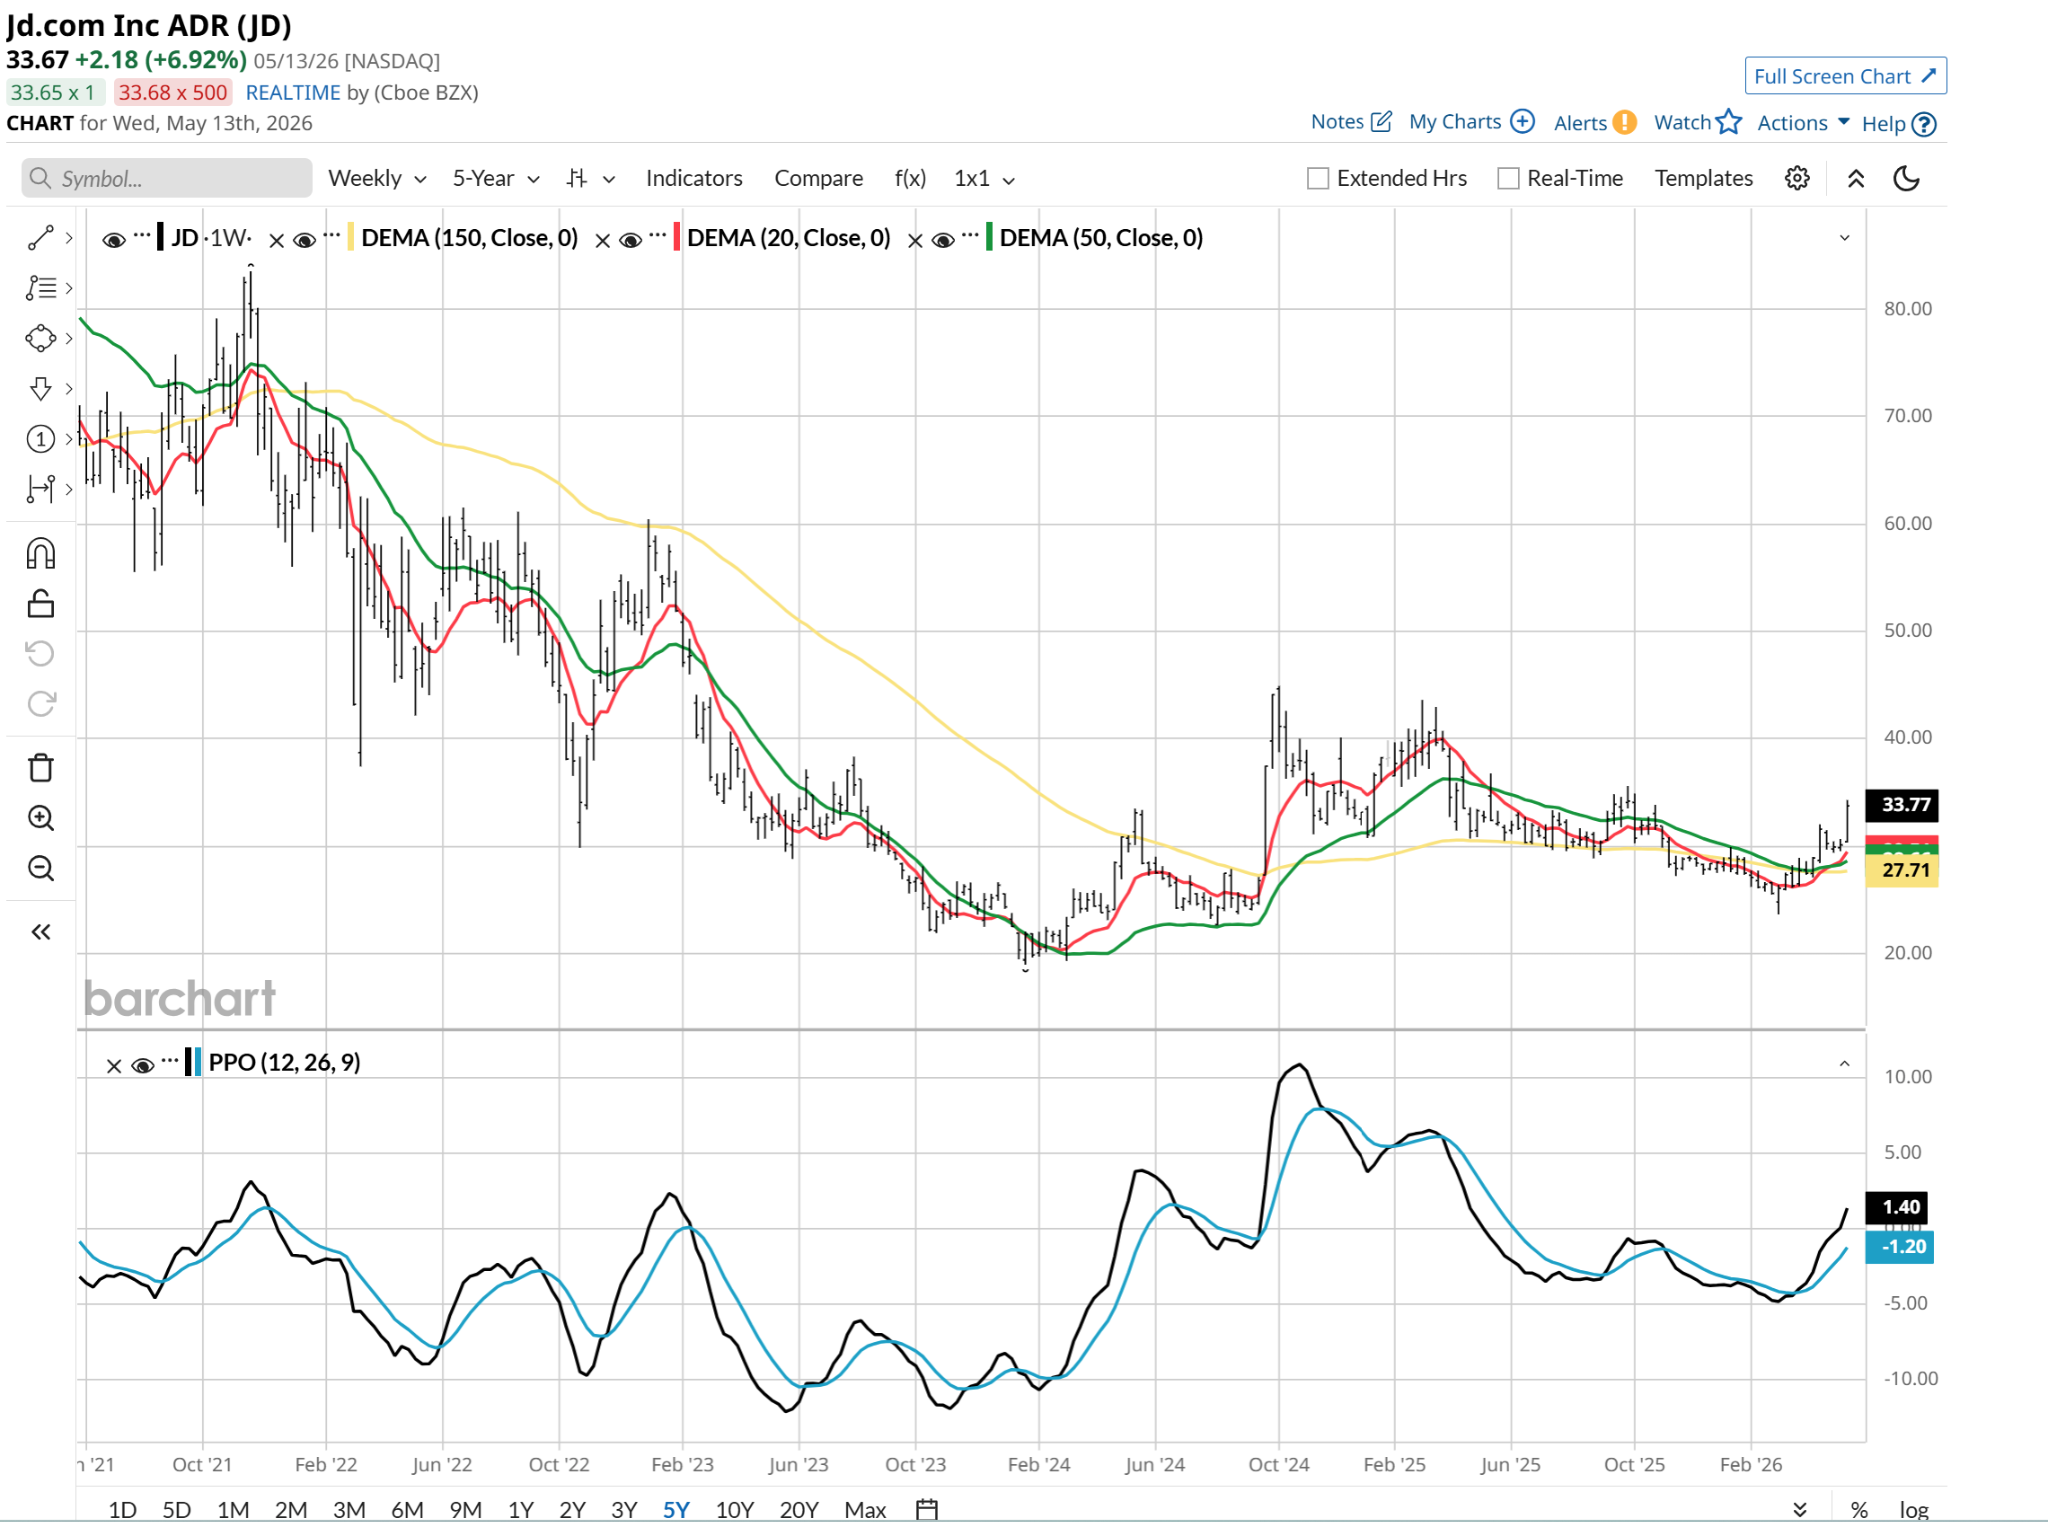
JD has rallied from its recent low around $24.50 just 9 weeks ago in early March. Its 20-day moving average is strong, as is its 50-day moving average of $30.42 as of Wednesday’s market close. The PPO indicator has recently undergone a bullish crossover and is trending higher, a sign of increasing momentum as the stock recovers from historical valuation lows. After clearing the $30 psychological level, the stock appears to be moving toward a gap-fill target near the $37 mark, last touched about 12 months ago.
Barchart Technical Indicators for JD.com
Editor’s Note: The technical indicators below are updated live during the session every 20 minutes and can therefore change each day as the market fluctuates. The indicator numbers shown below therefore may not match what you see live on the Barchart.com website when you read this report.
- 56% “BUY” Technical Signal: Barchart Opinion’s current technical assessment reflects a firming short-term trend as the stock stays above key moving average. Its Current Strength is rated “Good,” while its Current Direction is rated “Strengthening.”
- That signal is up from 24% “BUY” a month ago, an important sign of a recovering stock price trend.
- Trend Seeker “Buy”: This trend-following indicator flipped to a buy position back on March 16, which was a higher-risk entry than today. The stock is up 20% since that time, but for a stock which was so out of favor for a while, that’s just the “ante” for traders spying a bigger move.
- The weekly PPO just crossed up through the zero level, indicating an intermediate, positive change in trend. The longer-term resistance levels for JD to shoot for include $45, $60 and $80.
Don’t Forget the Fundamentals
- $45 billion market capitalization.
- 14.6 trailing price-earnings ratio.
- 11.5 forward price-earnings ratio.
- A debt to equity ratio of just 0.24.
- A price to sales ratio of just 0.23.
Analyst and Investor Sentiment on JD.com
- Wall Street Analysts: A consensus of 23 analysts surveyed by Barchart rated JD a “Strong Buy,” with 20 of those being “Buy” ratings.
- Price Targets: 12-month targets range from a conservative $25 to a high of $50, with an average consensus near $39.
The Bottom Line on JD.com
JD.com is currently firing on all cylinders technically, having successfully defended its multi-year valuation floor before breaking out following a strong Q1 report. The stock’s shift toward record retail margins and aggressive shareholder returns, including a $0.98 annual dividend (dividend yield of over 3%) could mark a significant turning point for long-term investors.
While macroeconomic headwinds in China remain a factor, the stock’s price trend and positive earnings revisions suggest a decidedly more bullish outlook than it has had for some time.
Additional disclosure: The Barchart Chart of the Day highlights stocks that are experiencing exceptional current price appreciation. They are not intended to be buy recommendations as these stocks are extremely volatile and speculative. Should you decide to add one of these stocks to your investment portfolio it is highly suggested you follow a predetermined diversification and moving stop loss discipline that is consistent with your personal investment risk tolerance.
On the date of publication, Jim Van Meerten did not have (either directly or indirectly) positions in any of the securities mentioned in this article. All information and data in this article is solely for informational purposes. For more information please view the Barchart Disclosure Policy here.

/A%20Palantir%20sign%20displayed%20on%20an%20office%20building%20by%20Poetra_RH%20via%20Shutterstock.jpg)

/Lululemon%20Athletica%20inc_%20phone%20and%20website%20by-%20T_Schneider%20via%20Shutterstock.jpg)
/Quantum%20Computing/Image%20by%20Funtap%20via%20Shutterstock.jpg)