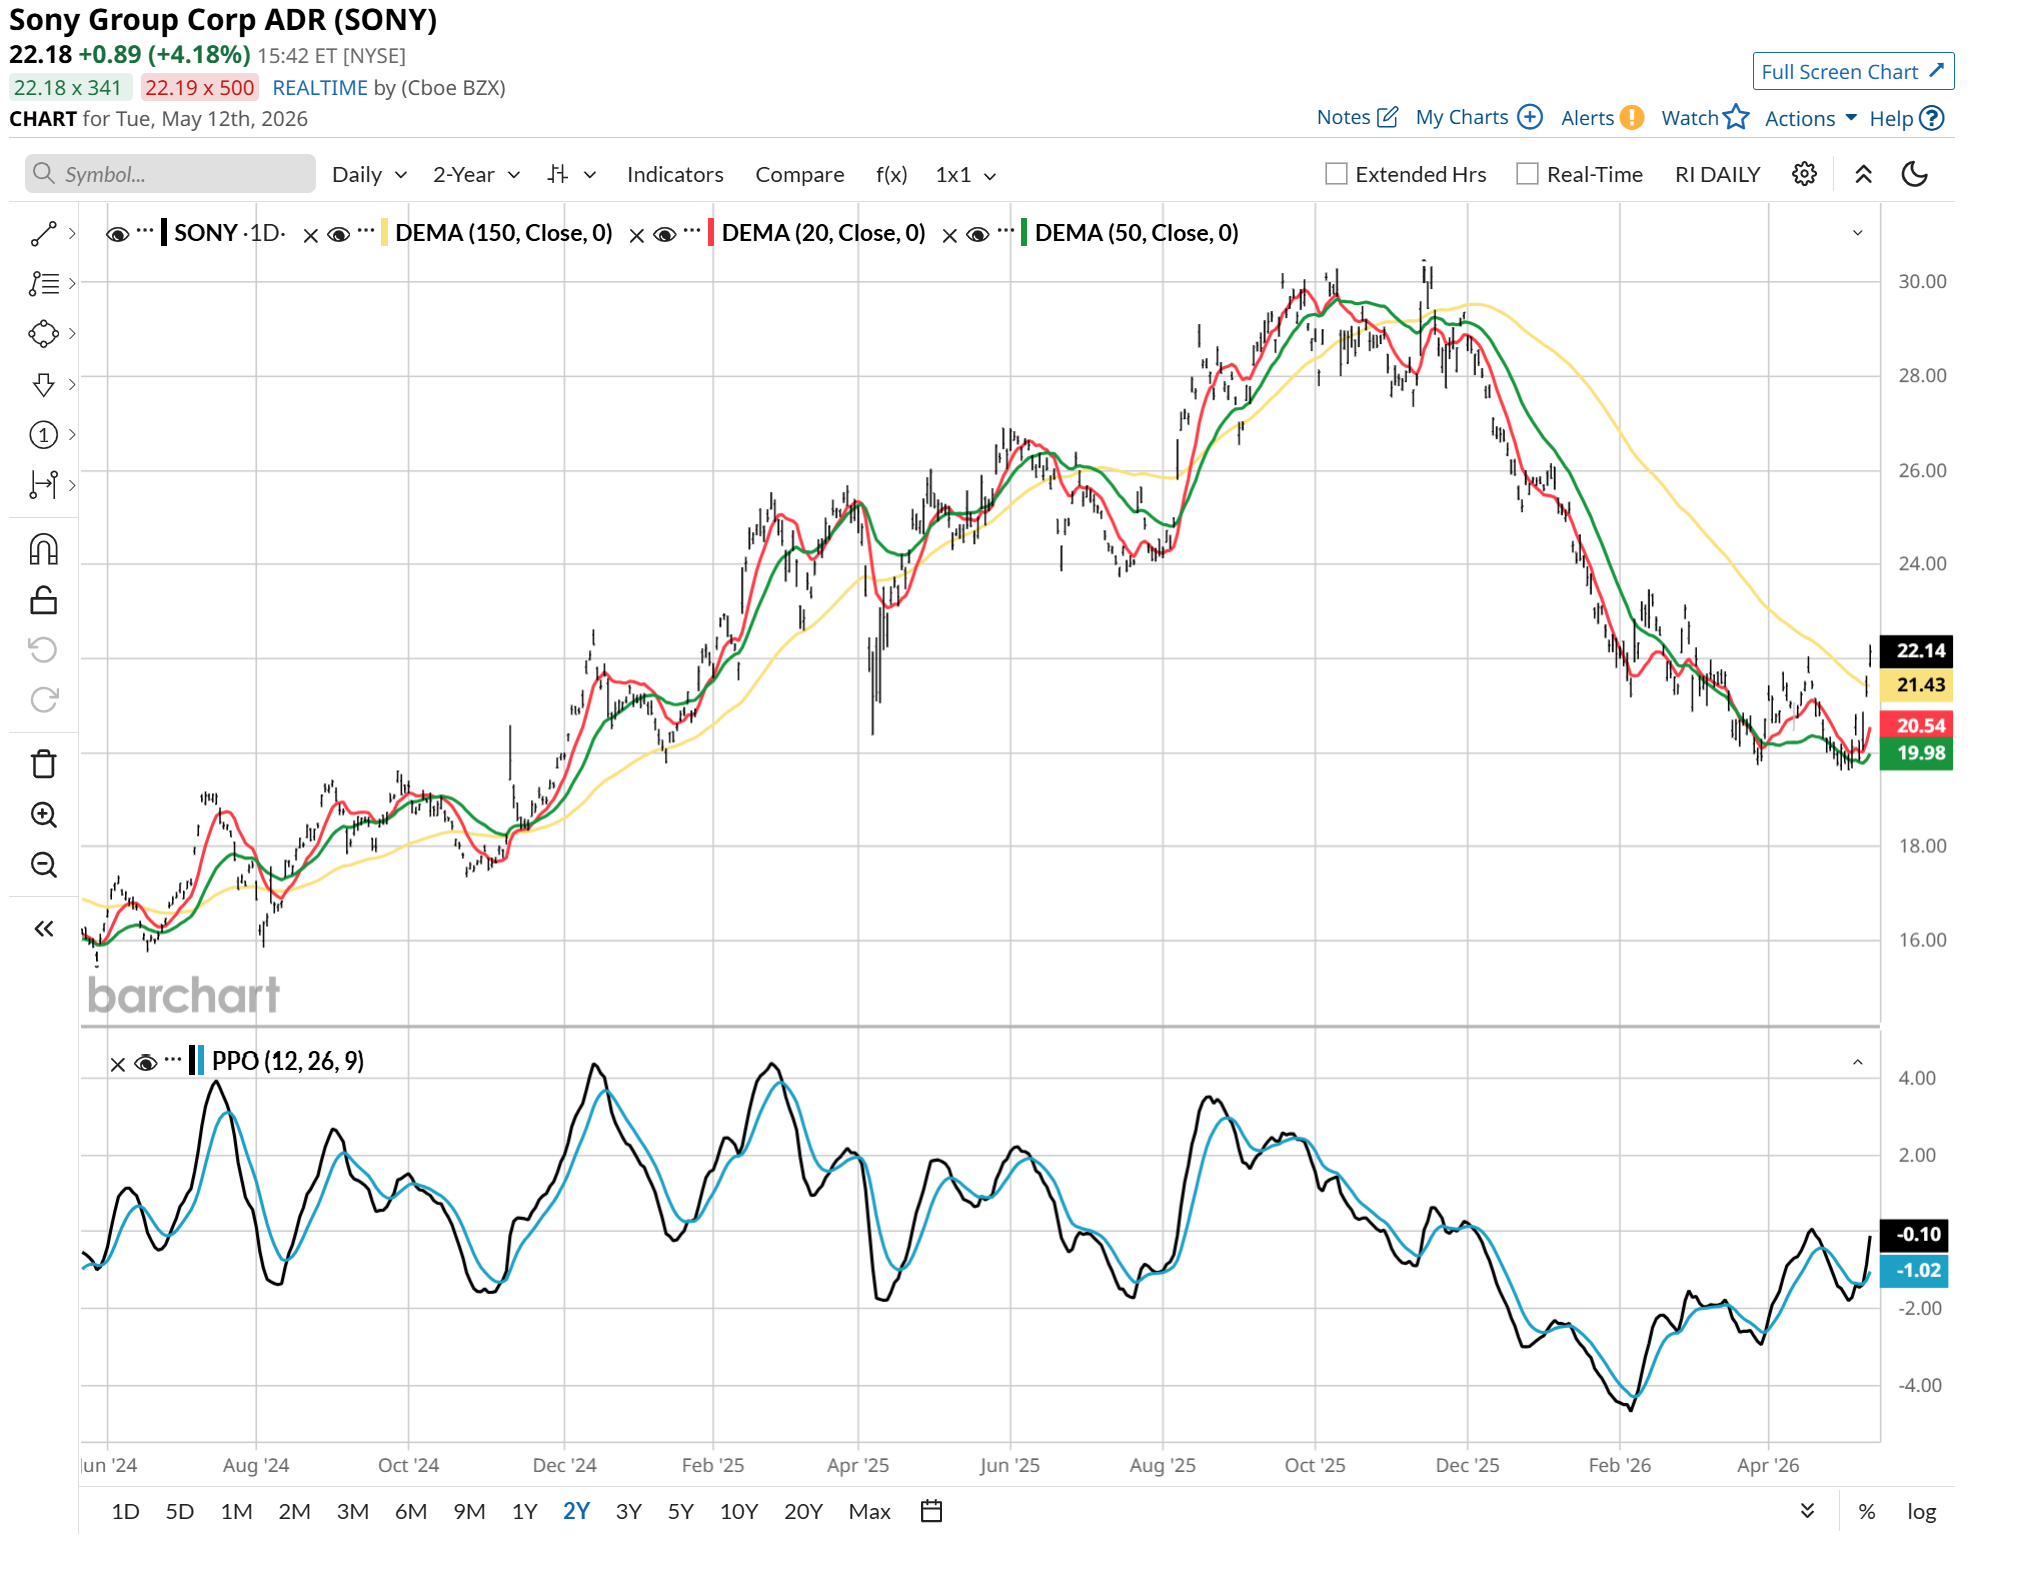
- Sony Group (SONY) shares have begun to stabilize, trading north of $22 as short-term technicals point toward a burgeoning recovery phase.
- The stock recently generated a Trend Seeker “BUY” rating, which makes SONY a technical turnaround candidate.
- Sony’s price action is now testing the $20.85 level, its 20-day moving average, a key hurdle for confirming a near-term bullish reversal.
- Despite recent consolidation, increasing analyst optimism around earnings revisions suggests potential 35% upside from the current level to the average analyst price target tracked by Barchart.
Today’s Featured Stock
Valued at $126 billion, Sony Group (SONY) is a global conglomerate specializing in consumer electronics, gaming, entertainment, and financial services. The company is currently focused on expanding its high-margin gaming and sensor businesses to offset legacy hardware cycles.
What I’m Watching
I found today’s Chart of the Day by using Barchart’s powerful screening functions to sort for stocks with notably improving technicals, a combination of momentum, strength, and direction. I then used Barchart’s Flipcharts feature to review the charts for timely opportunities. SONY checks those boxes.
SONY has rallied from its recent low around $20 earlier this month. Its 20-day moving average just turned higher, and the 50-day moving average is close to doing the same. The PPO indicator is beginning to curve upward toward a bullish crossover, a sign of increasing momentum. After a disappointing Q4 earnings miss, the market is now looking ahead to FY2026 guidance as a primary catalyst for a trend change.
Barchart Technical Indicators for Sony Group
Editor’s Note: The technical indicators below are updated live during the session every 20 minutes and can therefore change each day as the market fluctuates. The indicator numbers shown below therefore may not match what you see live on the Barchart.com website when you read this report.
- 56% “Sell” Barchart Opinion: While currently a “Sell,” the “Strength” rating has improved significantly from last month’s deep oversold reading, now posted a reading of “Average.” Unlike many recently featured stocks here, this one is a turnaround situation that is just beginning to show “green shoots.”
- Trend Seeker Status: The Trend Seeker turned positive on May 12, its first “Buy” signal since last November.
- The stock has bottomed in its current area ($20-$21) three times in the past 18 months. That indicates a willingness of investors to buy it with conviction in that price area, a positive sign.
- SONY’s 4% rally Tuesday in a down market pushed it above its 150-day moving average for the first time since late last year.
Don’t Forget the Fundamentals
- $126 billion market capitalization.
- 15x forward price-earnings ratio.
- 7x price/earnings-growth (PEG) ratio.
- 0.12x debt-equity ratio.
- 1.45x price-sales ratio.
Analyst and Investor Sentiment on Sony Group
- Wall Street Analysts: A consensus of 12 analysts surveyed by Barchart currently rate SONY a “Strong Buy,” reflecting optimism in earnings revisions.
- Price Targets: 12-month targets range from a conservative $22.00 to a high of $34.00, with an average consensus near $29.75.
The Bottom Line on Sony Group
Sony is currently navigating a technical base-building phase, having successfully defended the $20 psychological support level after its recent earnings report. The stock’s improving momentum profile and positive earnings estimate revisions suggest that the worst of the selloff may be behind it.
While investors should be cautious of the current “Sell” technical opinion, the combination of a low forward P/E and a 40% analyst upside target makes this tenured Japanese blue-chip stock a compelling recovery play.
On the date of publication, Jim Van Meerten did not have (either directly or indirectly) positions in any of the securities mentioned in this article. All information and data in this article is solely for informational purposes. For more information please view the Barchart Disclosure Policy here.

/An%20Intel%20sign%20out%20front%20of%20a%20corporate%20office%20by%20wolterke%20via%20Adobe%20Stock.jpeg)
/Alibaba%20by%20testing%20via%20Shutterstock.jpg)
/Alphabet%20(Google)%20Image%20by%20Markus%20Mainka%20via%20Shutterstock.jpg)