/Home%20Depot%2C%20Inc_%20app%20on%20phone%20by-%20IgorGolovniov%20via%20Shutterstock.jpg)
While Home Depot (HD) typically represents a reliable stalwart in the equities market, circumstances have not been kind to HD stock. Since the start of the year, shares have slipped more than 9%. Perhaps most ominously, the home improvement giant ignominiously earned a 100% Strong Sell rating from the Barchart Technical Opinion indicator. However, the smart money may be eyeballing a contrarian opportunity.
To quickly recap how we got here, HD stock has been consistently week over the trailing one-year period, losing roughly 14%. One of the recent negative catalysts stem from the fourth-quarter disclosure, where Home Depot provided a cautious outlook for fiscal 2026. A major culprit here is that because large-scale home projects remain muted, profitability has been under pressure.
Another factor is the company’s more aggressive investing in the professional contractor market. Although this move arguably offers a strong long-term narrative, the strategy is also capital intensive, especially against the framework of short-term margins and free cash flow. Combined with the broader macro and geopolitical environment, HD stock has uncharacteristically struggled.
Nevertheless, the magnitude of this struggle is unusual — and this circumstance has apparently sparked upside curiosity among Wall Street pros.
A Reverse Skew Sends an Intriguing Signal for HD Stock
There’s a common notion that the smart money is more prescient than the public money — and that’s not an unreasonable assertion. While it’s not necessarily true that pro traders are better stock pickers in all circumstances, sophisticated market participants tend to have better information and trade it more upstream. Thus, the positioning of these smart trades could be an interesting tell.
Looking at the volatility skew for HD stock for the June 18 options chain, we see what’s known as a reverse skew. By definition, the skew shows implied volatility (IV) across the strike price spectrum of a particular expiration date. Generally speaking, a volatile security like Home Depot would see put IV elevated at strike prices below the current spot price. In this case, call IV is much more pronounced at the lower strikes.
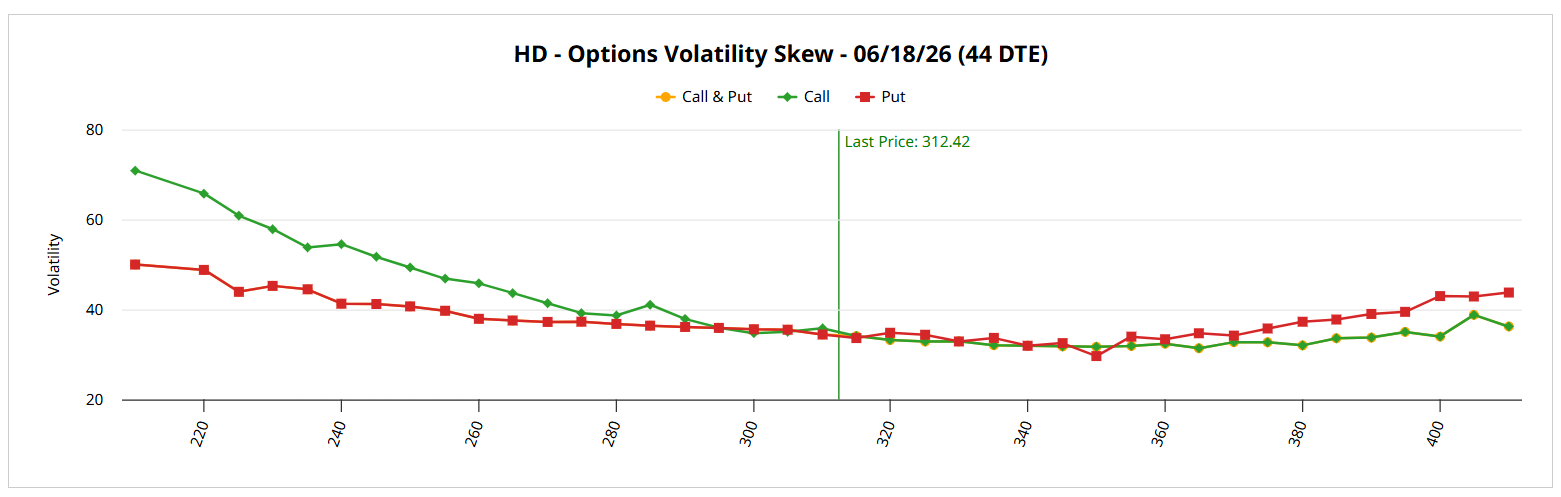
With this inverted smirk, traders are bidding up the volatility of calls at lower strikes (the left tail). Effectively, this dynamic suggests that the market is overcharging for the leverage found in these deep in-the-money (ITM) calls. In contrast, put IV sits lower at the left tail, implying that the priority among smart money traders is not downside protection.
Again, with how disappointing HD stock has been — combined with the fact that the underlying company will release its next earnings report on May 19 — the more rational move (if traders were fearful) would be to bid up protective puts. That’s not happening here, which may give the bulls some optimism.
Of course, volatility skew is like auto insurance. Just because you pay more for coverage doesn’t necessarily mean that the chances of getting into an accident will rise. To better understand where HD stock might end up, we can turn to inductive probabilities.
Using Quick Science to Guide Our Trading
At the most basic level, induction is a fancy term for pattern recognition. Relying on the uniformity of nature, inductive methodologies assume that the future will resemble the past. We can get into a really long, philosophical discussion about the process but ultimately, we’re seeking an “if this, then that” type of framework.
In other words, by analyzing the past historical data of HD stock, we can estimate to a reasonably accurate degree of probability what the return profile of Home Depot would be over a given time period. However, we’re not interested in betting on HD as a random, aggregate performance profile. Instead, we’re interested in the specific signal at hand.
One of the distinct quantitative markers that I noticed was that, in the past 10 weeks, HD stock printed only two up weeks, leading to an overall downward slope. This sequence has only appeared 11 times on a rolling basis since January 2007. Based on the data, after this signal materializes, HD has demonstrated a median forward distribution over the next 10 weeks, landing between $290 and $380 (assuming a starting price of $312.42).
Now, I must caveat the above by acknowledging the small sample size. However, given the length of the dataset and the consistency of Home Depot’s business (i.e. the foundation of a hammer hasn’t changed much since its invention), there’s a rational reason to have some confidence in this inductive inference.
Aggressive speculators may want to consider the 335/340 bull call spread expiring June 18. This spread is aiming for HD stock to rise through the $340 strike at expiration. If it does, the maximum payout stands at roughly 223%.
On the date of publication, Josh Enomoto did not have (either directly or indirectly) positions in any of the securities mentioned in this article. All information and data in this article is solely for informational purposes. For more information please view the Barchart Disclosure Policy here.