
- Softs sector markets have taken turns rallying over the last few years, with most of the moves tied to global weather.
- One of the latest to make a strong move is cocoa, with the majority of key growing areas seeing weather patterns reducing production.
- However, supply driven markets are usually short-term meaning the dynamics of the market change with the weather.
I had a question come in late Friday about the high price of chocolate. My guess on how the scenario played out is my friend took his kids to the store to buy a last-minute Mother’s Day gift, something I also did back in the day, and experienced a mild form of sticker shock when the kids came back with their choices. He may have still been in the checkout line (with all the other dads) when he started his message to me, “Do you write about Softs?!” I confirmed to him I did, and just recently was part of a piece in MarketWatch written by my long-time friend Myra Saefong talking about how the various markets in the softs sector have taken turns going to new highs of late. To recap:
- Lumber (Yes, technically a member of the softs sector) hit a new all-time high in May 2021 as the previous US administration’s ridiculous trade spat with Canada (one of the US’ leading trade partners) reduced supplies while stay-at-home pandemic demand raged.
- Coffee (KCN23) percolated higher through February 2022, hitting its highest price since September 2011 as Brazilian production remained under the influence of a La Nina pattern that would not go away.
- Orange juice (OJN23) greened through April 2023, reaching a new all-time high as the aforementioned La Nina affecting Brazil turned to an El Nino, bringing flooding rains to parts of the country’s growing regions. Add in the US’ continued struggle with the bacterial disease “citrus greening”, and global supplies tightened considerably.
- Then we have sugar (SBN23) as it also rallied through April 2023, notching its highest price since October 2021. The rally was once again attributed to weather: the previous drought in Brazil and flooding in India, to go along with the chronically weak Brazilian real.
Outside of lumber, the consistent theme is exactly what we would expect: The various softs markets were all driven higher by weather to some degree or another. This brings to mind what I have long said: The commodity complex in general is made up of markets that at their core are weather derivatives.
Which brings us back to cocoa. Last week saw the expiring May contract (CCK23) hit a high of $3,279 (per metric ton), the highest price for a nearby futures contract since December 2015. Why? According to other sources cited in Myra’s MarketWatch piece, “adverse weather conditions in ‘practically all’ major producers, particularly Cote d’Ivoire (Ivory Coast) in West Africa and Ghana – which together account for more than 60% of global output – has led to a decline in cocoa production”.
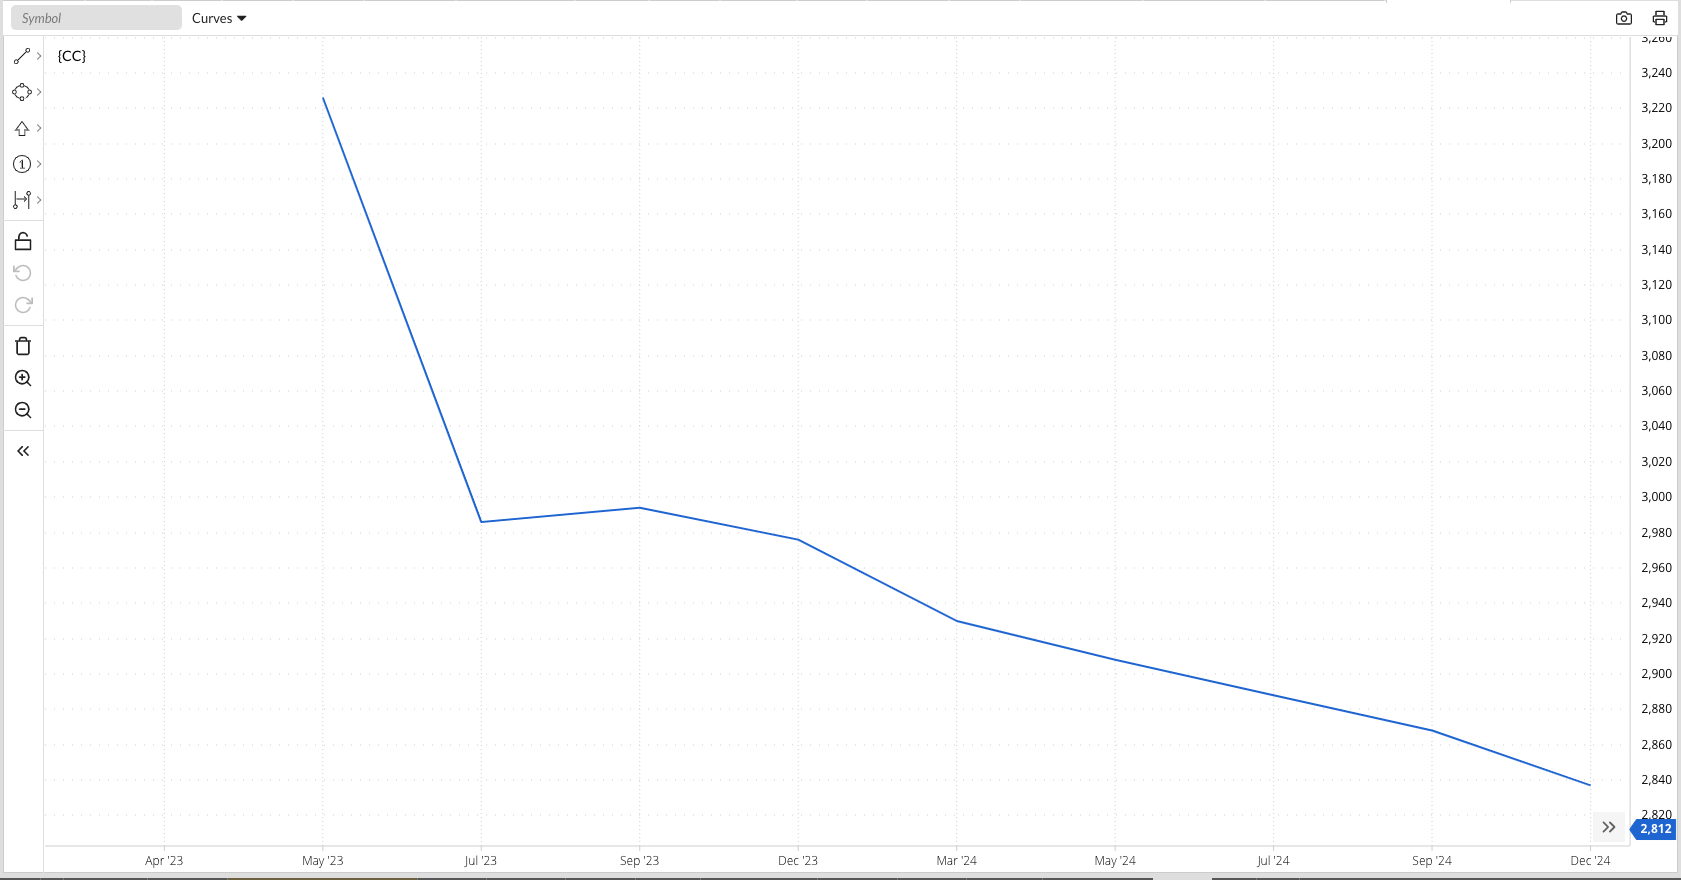
We know how cocoa reached these price levels, but the real question from an investor point of view is “how long will it last”? We’ve seen the other softs markets rise and fall, basically, illustrating the key difference between supply driven (short-term) and demand driven (long-term) rallies. Fundamentally, the various softs markets remain bullish with forward curves for coffee, orange juice, sugar, and even cocoa still showing inverses (backwardation, for those of you trading in New York). But as we’ve see in so many other commodities, most notably crude oil wheat, backwardation does not mean investment money will continue to flow into a particular market.
Two things we have to remember when it comes to investment money: Newton’s First Law of Motion applied to markets, “A trending market will stay in that trend until acted upon by an outside force, with that outside force usually noncommercial (investment) activity”. Also, Newsom’s Market Rule #1 that says, “Don’t get crossways with the trend.” In a nutshell, trends are set by the flow of noncommercial money and most of us aren’t big enough to step in front of them.
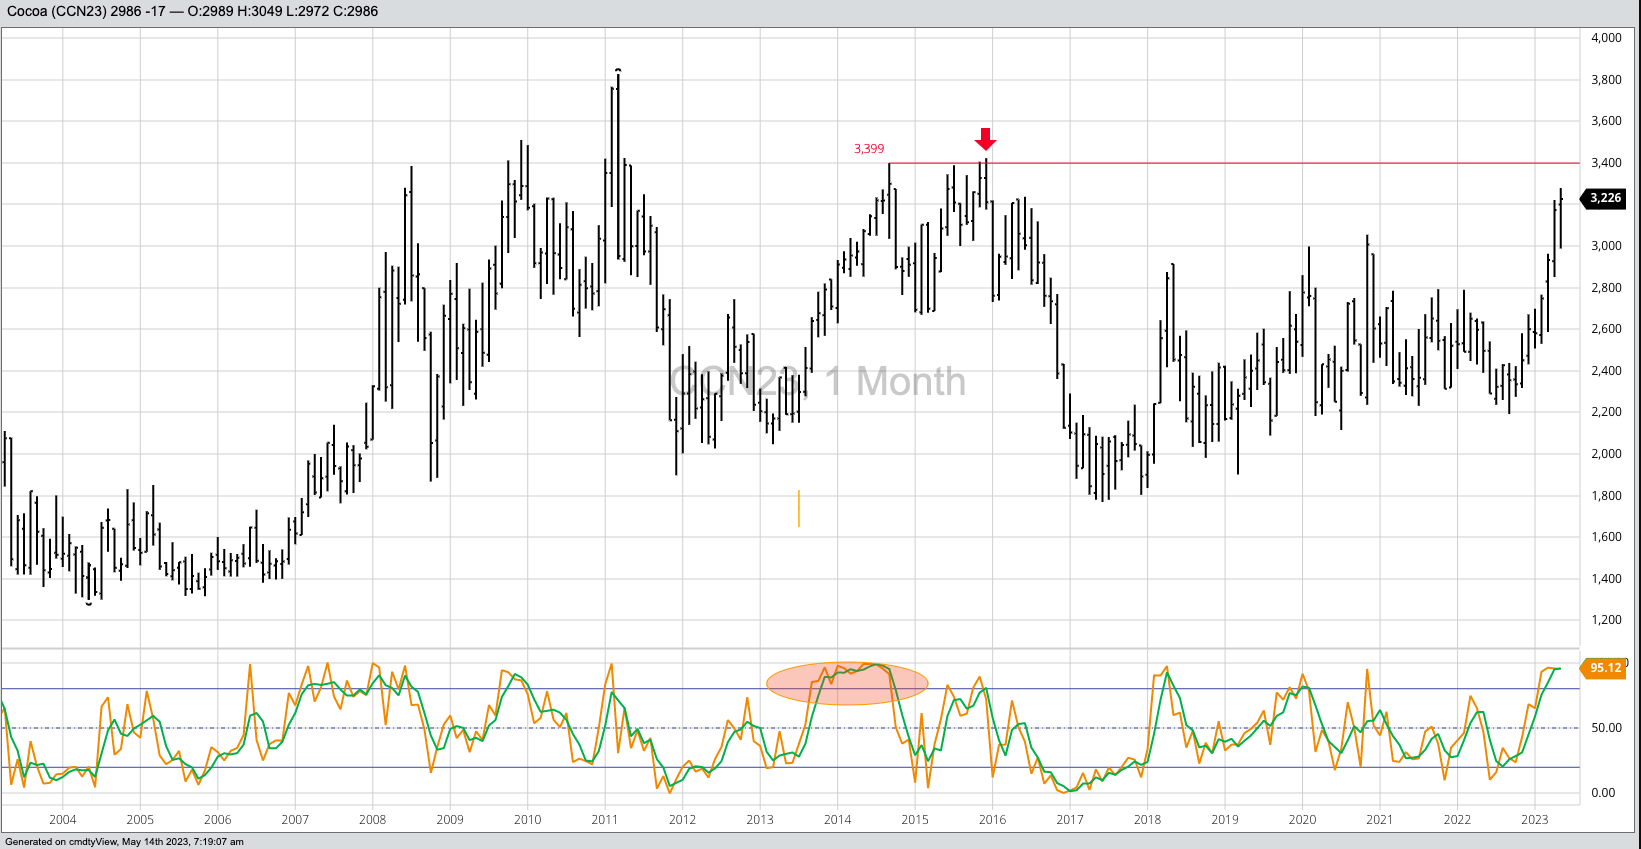
The latest CFTC Commitments of Traders report (legacy, futures only) showed fund traders increased their net-long futures position by roughly 4,080 contracts, putting it at 62,023 contracts as of Tuesday, May 8. How much more will this group be willing to buy, even with the bullish long-term fundamentals of an inverted forward curve? From a technical point of view there is a pocket of resistance with high near $3,400 from September 2014 through December 2015. It should also be noted monthly stochastics (momentum indicator) have moved above the overbought level of 80%, just as they did from November 2013 through September 2014. While this indicator could slow buying interest, the important lesson here is affirmation of the old saying “markets can stay overbought (or oversold) longer than most of us can stay solvent.
Again going back to technical patterns: With the May issue going off the board at an inverse of $239 to July, the latter will have to close above the April settlement of $3,174 by the end of May to avoid completing a long-term bearish spike reversal. If you trace the market back to December 2015, we saw the nearby contract complete a bearish key reversal that turned the trend down.
Until then, and in honor of Mother’s Day, we need to keep in mind the lesson Forrest Gump’s mama taught us, “Life is like a box of chocolates. You never know what you’re going to get.”
On the date of publication, Darin Newsom did not have (either directly or indirectly) positions in any of the securities mentioned in this article. All information and data in this article is solely for informational purposes. For more information please view the Barchart Disclosure Policy here.
/Microsoft%20headquarters%20By%20Peter.jpeg)
/NVIDIA%20Corp%20logo%20outside%20building-by%20BING-JHEN_HONG%20via%20iStock.jpg)
/Micron%20Technology%20Inc_%20logo%20on%20building-by%20vzphotos%20vis%20iStock.jpg)
/Amazon%20-%20Image%20by%20bluestork%20via%20Shutterstock.jpg)
