
The ongoing war in Ukraine, hostilities in the Middle East, rising U.S. debt, concerns about consumer debt and bank loans, and U.S. political division have not prevented the bull market in stocks from charging higher. The S&P 500 index, the most diversified U.S. stock market index, fell in Q1 2026 but recovered, rising above 7,000 and reaching a new all-time high in April 2026.
I asked if the S&P 500 could reach 10,000 in a December 30, 2025, Barchart article, concluding with the following:
Gold is telling us that the benchmark pricing mechanism for the U.S. stock market and the S&P 500 could be flawed, making U.S. stocks inexpensive at current levels. Thus, my call is that the S&P 500 may ignore P/E ratios and other traditional metrics and rise to my 10,000 target sometime in 2026. The SPX at 10,000 would have a significant bullish impact on all U.S. and other stock market indices.
Gold was trading near $4,350 per ounce in late December, with the S&P 500 index just below 6,900. On April 27, 2026, gold was near $4,700 per ounce after reaching a high of $5,626.80, and the S&P 500 was above 7,150.
The leading stock market index fell in Q1 2026
The S&P 500 is the most diversified U.S. stock market index, and it posted a 4.63% decline in the first quarter of 2026.
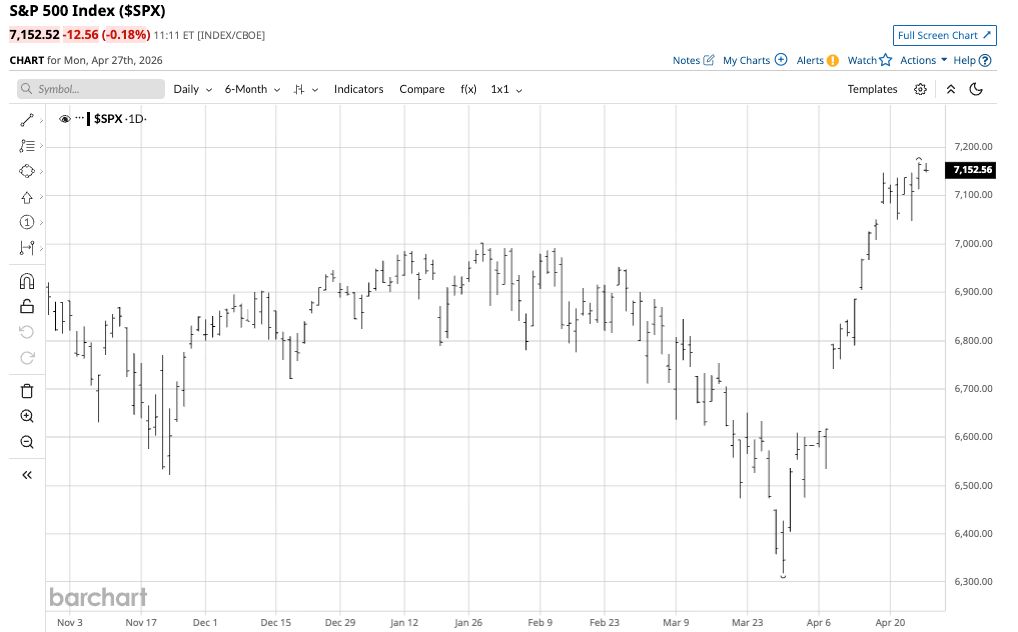
The daily six-month chart shows that the index closed 2025 at 6,845.50 and fell to 6,528.52 on March 31, 2026.
The hostilities in the Middle East caused the S&P 500 to decline in March 2026, but a ceasefire put the index back on a bullish path in April.
A similar pattern to Q1 2025
The seven-year monthly chart shows that the S&P 500 fell in Q1 2025.
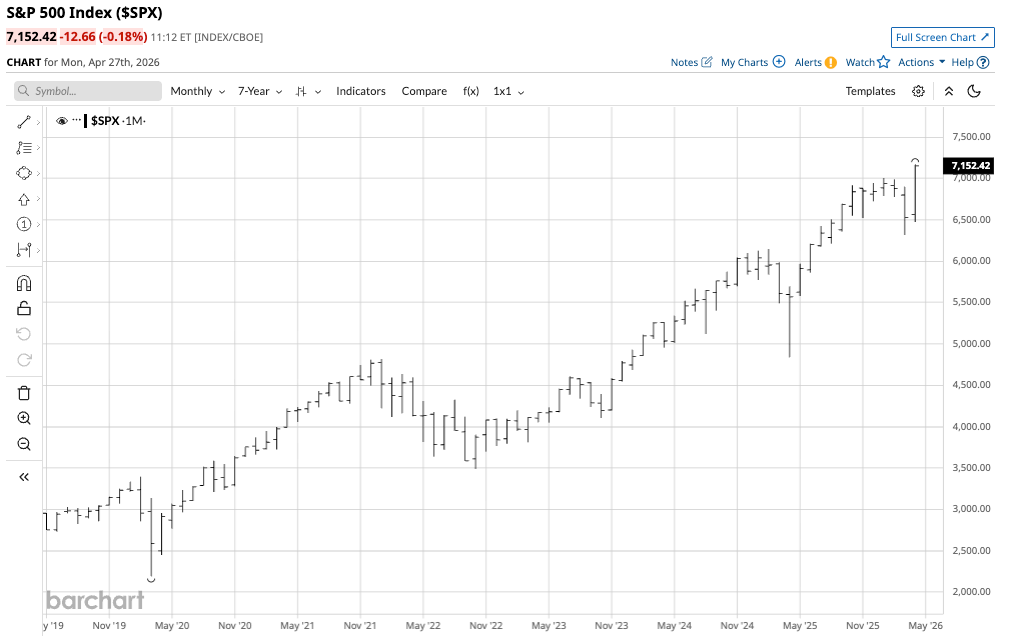
As the chart highlights, the index fell 4.59% in Q1 2025. While the S&P 500 reached a low in April 2025 when the U.S. administration announced its “Liberation Day” tariff policy, the index rose 16.39% in 2025.
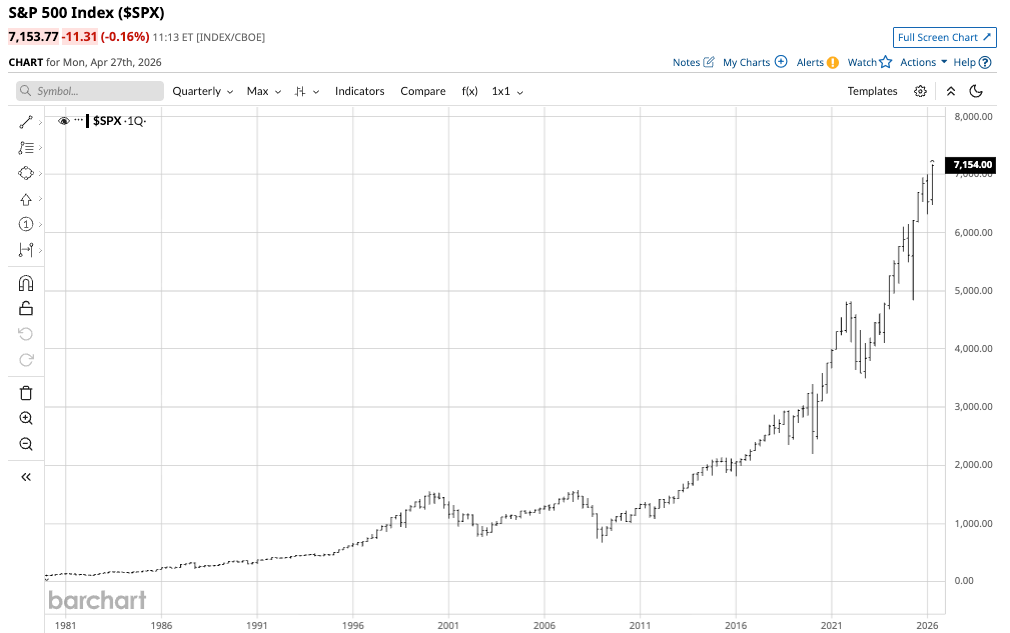
The long-term quarterly chart highlights the bullish trend in the leading U.S. stock market index that continued with a new high in April 2026.
The leading stock market index continues to make new highs, but it faces bullish and bearish factors in late April 2026.
Many factors could derail the stock market rally
The bearish issues facing the stock market are as follows:
- Uncertainty surrounding the hostilities in the Middle East could weigh on the stock market over the coming weeks and months.
- If oil prices rise from current levels, it will put upward pressure on inflation, leading to higher interest rates and lower stock prices.
- The U.S. debt, approaching $40 trillion, could weigh on bonds and put pressure on stocks.
- The upcoming U.S. midterm elections could cause selling in the stock market.
- U.S. tariff policies and sanctions could weigh on stocks.
- Unforeseen events tend to have the greatest negative impact on the stock market.
Many factors could weigh on stocks over the coming weeks and months.
The factors supporting higher highs
The bullish factors supporting the stock market are as follows:
- Earnings remain robust, and they are the critical factor in the path of least resistance for stock prices.
- The U.S. economy continues to grow, which is bullish for stock prices.
- A satisfactory settlement of the hostilities in the Middle East that pushes crude oil prices lower would likely ignite a substantial stock market rally.
- The long-term trend in stocks remains bullish, and the trend is always a trader’s or investor’s best friend.
The bottom line is that the stock market and the S&P 500 face bullish and bearish factors in late April 2026. As stocks rise, the risk of a correction increases, but corrections have been long-term golden buying opportunities.
SPY is the ETF that tracks the S&P 500
The SPDR S&P 500 ETF Trust (SPY) is highly liquid and tracks the S&P 500 index. At around $713 per share, SPY had over $729.06 billion in assets under management. SPY trades an average of more than 63.6 million shares per day, charges a 0.09% management fee, and has a blended dividend of $7.38, yielding 1.04%, compensating for the expense ratio in under two months.
I continue to rate the S&P 500 and SPY ETF buys in the current environment. However, buying on corrections, creating price weakness, has been optimal for years, and I expect that trend to continue. If the stars line up for the stock market over the coming weeks and months, the same price appreciation as in 2025 would take the S&P 500 to the 7,600 level, which is an upside target. However, oil and gold have developed an inverse correlation over the past months. Strength in gold and declining oil prices could surprise the stock market on the upside, sending the S&P 500 well over 8,000 before the end of 2026.
On the date of publication, Andrew Hecht did not have (either directly or indirectly) positions in any of the securities mentioned in this article. All information and data in this article is solely for informational purposes. For more information please view the Barchart Disclosure Policy here.

/Micron%20Technology%20Inc_%20logo%20on%20building-by%20vzphotos%20vis%20iStock.jpg)

/AI%20(artificial%20intelligence)/AI%20engineer%20working%20on%20laptop%20by%20ART%20STOCK%20CREATIVE%20via%20Shutterstock.jpg)
