Editor's note: Any and all references to time frames longer than one trading day are for purposes of market context only, and not recommendations of any holding time frame. Daily rebalancing ETFs are not meant to be held unmonitored for long periods. If you don't have the resources, time or inclination to constantly monitor and manage your positions, leveraged and inverse ETFs are not for you.
Investing in the funds involves a high degree of risk. Unlike traditional ETFs, or even other leveraged and/or inverse ETFs, these leveraged and/or inverse single-stock ETFs track the price of a single stock rather than an index, eliminating the benefits of diversification. Leveraged and inverse ETFs pursue daily leveraged investment objectives, which means they are riskier than alternatives which do not use leverage. They seek daily goals and should not be expected to track the underlying stock’s performance over periods longer than one day. They are not suitable for all investors and should be utilized only by investors who understand leverage risk and who actively manage their investments. The Funds will lose money if the underlying stock’s performance is flat, and it is possible that the Bull Fund will lose money even if the underlying stock’s performance increases, and the Bear Fund will lose money even if the underlying stock’s performance decreases, over a period longer than a single day. Investing in the Funds is not equivalent to investing directly in ORCL.
Key Takeaways
Oracle’s cloud growth reinforces the AI infrastructure story. Cloud revenue surged 44% year-over-year as enterprise demand for AI workloads accelerates.
The stock still faces a technical test. Despite strong earnings, ORCL remains well below its 2025 highs.
Treasuries face competing forces. Geopolitical turmoil could spark safe-haven buying, but rising oil prices threaten inflation*.
Two catalysts loom. Oracle’s next earnings report and the April 10 inflation print could drive the next moves.
Two very different forces are shaping markets right now: artificial intelligence infrastructure spending and geopolitical shockwaves in the global energy market.
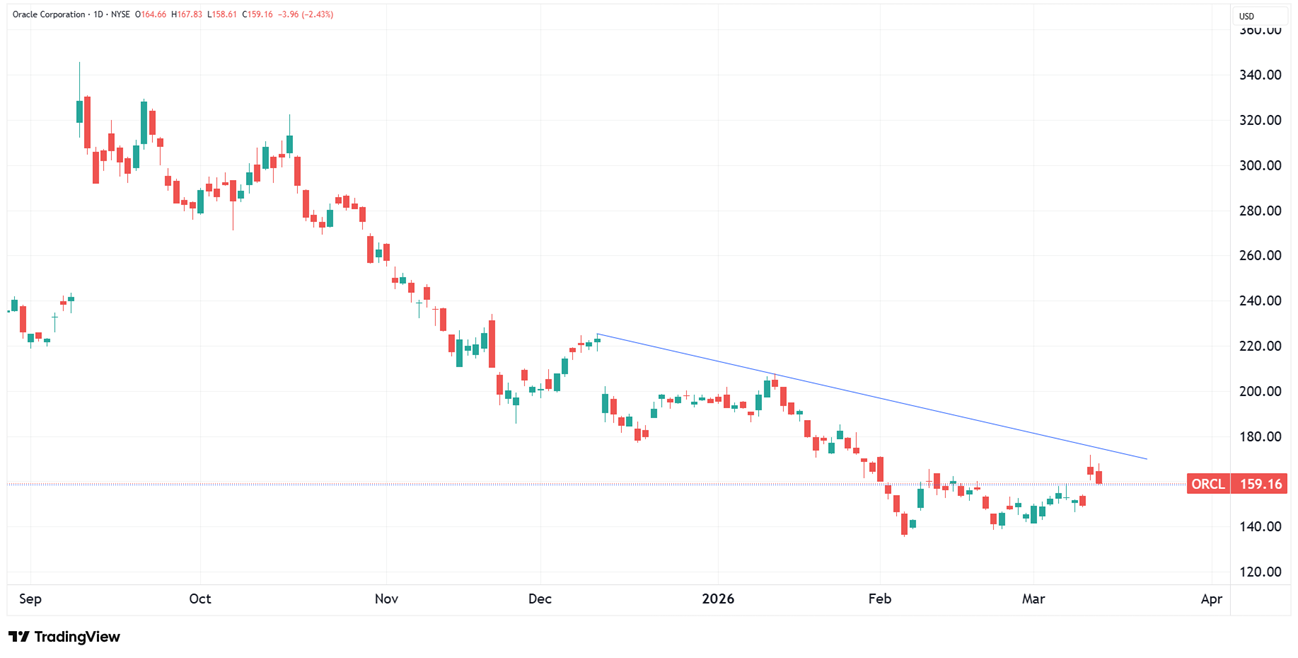
On the technology side, strong earnings from Oracle Corporation suggest enterprise demand for AI infrastructure remains robust. But despite the post-earnings pop, the stock is still well below its 2025 peak, raising the question of whether bulls are regaining momentum or if the rally is temporary.
Meanwhile, escalating tensions in the Middle East and disruptions around the Strait of Hormuz are driving volatility* in global energy markets and long-term bonds. That puts U.S. Treasuries at the center of a macro tug-of-war between safe-haven demand and inflation fears.
Together, these dynamics could determine where traders find the next opportunities across both equities and fixed income.
Oracle: AI Infrastructure Demand Keeps Growing
Oracle’s latest earnings offered a reminder that AI infrastructure spending remains powerful.
Cloud revenue reached $8.9 billion, up 44% year-over-year, fueled by demand for AI computing resources and strategic partnerships. Oracle’s cloud ecosystem—centered around its autonomous database and Oracle Cloud Infrastructure—continues to expand across enterprise customers.
The company’s installed base creates strong switching costs across databases, enterprise resource planning systems, and AI workloads. For many organizations, moving away from Oracle infrastructure would involve massive operational disruption.
Another key signal came from the company’s Remaining Performance Obligations backlog, which jumped to $553 billion. That enormous pipeline suggests future cloud and AI demand remains strong.
For traders who believe Oracle’s results signal renewed momentum, consider Direxion’s Daily ORCL Bull 2X ETF (Ticker: ORCU), which seeks daily investment results, before fees and expenses, of 200% of the performance of Oracle Corporation common stock (Ticker: ORCL).
Below is a daily chart of ORCL as of March 12, 2026.
Source: StockCharts.com
Candlestick charts display the high and low (the stick) and the open and close price (the body) of a security for a specific period. If the body is filled, it means the close was lower than the open. If the body is empty, it means the close was higher than the open.
The performance data quoted represents past performance. Past performance does not guarantee future results.
The Bear Case: High Expectations and Heavy Competition
Despite strong fundamentals, Oracle’s stock has struggled to sustain an uptrend since peaking in 2025.
Skeptics argue that:
AI infrastructure spending could normalize
Competition from Amazon Web Services and Microsoft Azure remains intense
Enterprise cloud migrations could slow if economic conditions weaken
Oracle’s valuation, often in the high-20s to low-30s forward price-to-earnings* range, also leaves little room for disappointment. If growth slows or guidance weakens, the stock could face renewed selling pressure.
In that scenario, Direxion’s Daily ORCL Bear 1X ETF (Ticker: ORCS), which seeks daily investment results, before fees and expenses, of 100% of the inverse performance in common shares of Oracle Corporation (Ticker: ORCL) could attract bearish traders.
Oracle’s next earnings report, expected in early June, may provide clearer answers about the trajectory of AI demand.
Long-Term Treasuries: Safe Haven or Inflation Casualty?
While technology investors debate AI spending, bond traders are watching a completely different story unfold.
Heightened tensions in the Middle East, and the closure of the Strait of Hormuz, have disrupted global oil flows and pushed crude prices higher. This development is injecting volatility into the bond market.
Long-duration Treasuries, tracked by the ICE U.S. Treasury 20+ Year Bond Index*, are particularly sensitive to shifts in inflation expectations and risk sentiment.
The Direxion Daily 20+ Year Treasury Bull 3X ETF (Ticker: TMF) and Daily 20+ Year Treasury Bear 3X ETF (Ticker: TMV) seek daily investment results, before fees and expenses, of 300%, or 300% of the inverse (or opposite), of the performance of the ICE U.S. Treasury 20+ Year Bond Index.
Scenario 1: Flight to Safety
Historically, geopolitical crises often push investors toward U.S. Treasuries.
If the conflict expands or drags on longer than expected, global markets could see a surge in safe-haven demand. This typically drives bond prices higher and yields lower.
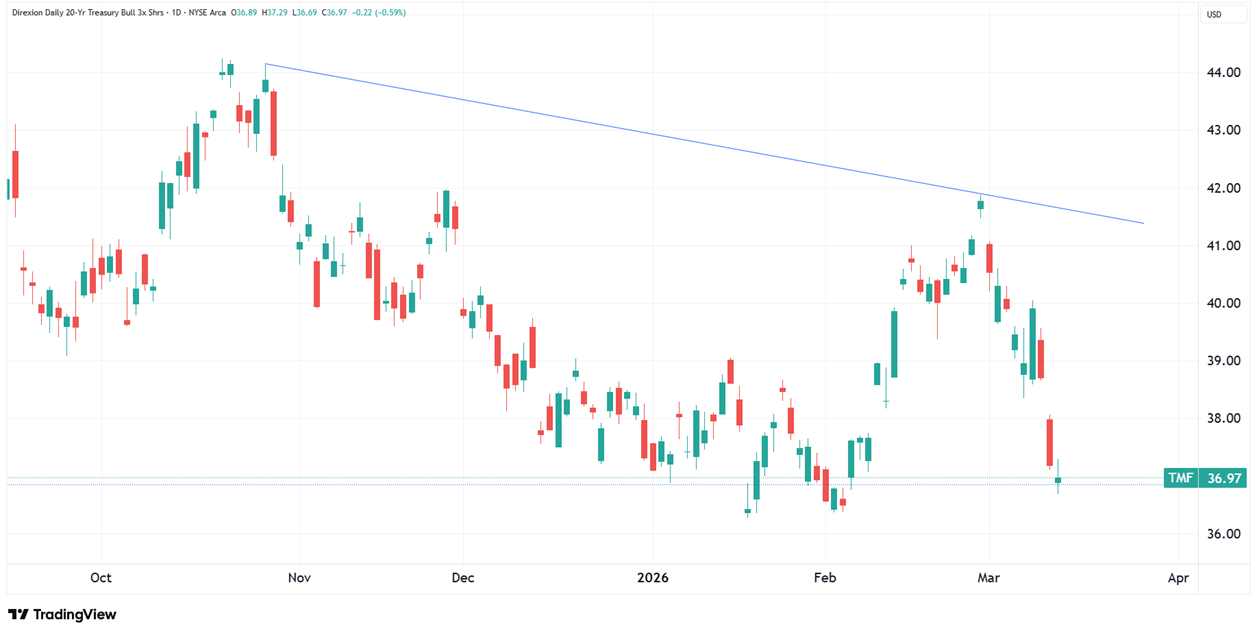
Such a move could benefit leveraged long-Treasury exposure such as TMF.
Below is a daily chart of TMF as of March 5, 2026.
Source: TradingView.com
The performance data quoted represents past performance. Past performance does not guarantee future results. The investment return and principal value of an investment will fluctuate. An investor’s shares, when redeemed, may be worth more or less than their original cost; current performance may be lower or higher than the performance quoted. For the most recent month-end performance go to Direxion.com/etfs. For standardized performance click here.
Candlestick charts display the high and low (the stick) and the open and close price (the body) of a security for a specific period. If the body is filled, it means the close was lower than the open. If the body is empty, it means the close was higher than the open.
Scenario 2: Inflation Shock
However, the same conflict is also driving oil prices higher.
Energy spikes can feed directly into inflation, raising consumer prices and pushing bond yields upward. In that case, long-duration Treasuries could fall as investors demand higher yields to compensate for rising inflation.
Traders concerned about that outcome may watch the April 10 inflation report closely. A hotter-than-expected reading could accelerate selling pressure in long-term bonds.
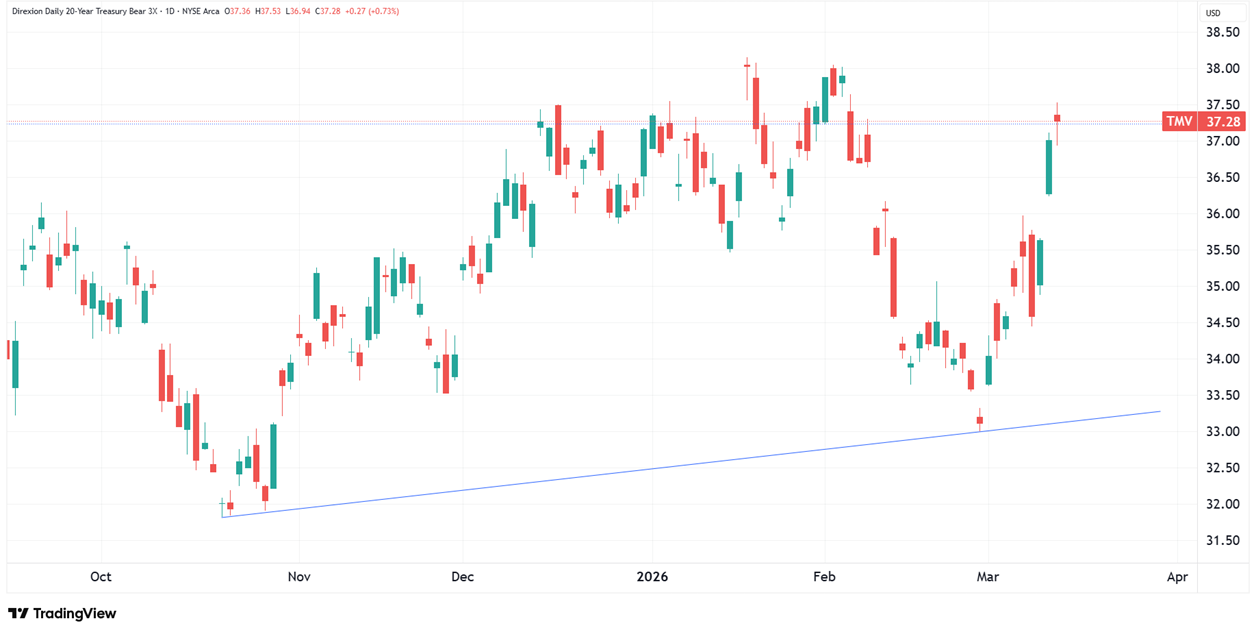
Inverse exposure like TMV could benefit in that environment.
Below is a daily chart of TMV as of March 12, 2026.
Source: TradingView.com
The performance data quoted represents past performance. Past performance does not guarantee future results. The investment return and principal value of an investment will fluctuate. An investor’s shares, when redeemed, may be worth more or less than their original cost; current performance may be lower or higher than the performance quoted. For the most recent month-end performance go to Direxion.com/etfs. For standardized performance click here.
Candlestick charts display the high and low (the stick) and the open and close price (the body) of a security for a specific period. If the body is filled, it means the close was lower than the open. If the body is empty, it means the close was higher than the open.
What Traders Are Watching Next
Markets are now juggling two very different macro narratives.
On one side is the durability of the artificial intelligence investment cycle. Oracle’s results suggest companies are still spending heavily on infrastructure needed to power AI applications.
On the other side is the impact of geopolitical tensions on energy prices and inflation expectations.
Key catalysts ahead include:
Oracle’s next earnings report in early June
The March consumer inflation report due April 10
Developments in Middle East tensions and oil supply
Final Conclusion
The next phase of market leadership may hinge on two very different forces.
If AI infrastructure demand continues expanding, Oracle and other enterprise cloud providers could regain momentum despite recent volatility.
But if geopolitical shocks push oil prices higher and inflation resurges, long-term Treasuries, and interest-rate expectations, may dominate the macro conversation.
For traders, the coming weeks could determine whether the market’s focus remains on artificial intelligence… or shifts toward inflation and global risk.
*Definitions and Index Descriptions
An investor should carefully consider a Fund’s investment objective, risks, charges, and expenses before investing. A Fund’s prospectus and summary prospectus contain this and other information about the Direxion Shares. To obtain a Fund’s prospectus and summary prospectus call 866-476-7523 or visit our website at direxion.com. A Fund’s prospectus and summary prospectus should be read carefully before investing.
The ICE U.S. Treasury 20+ Year Bond Index (IDCOT20TR) is a market value weighted index that includes publicly issued U.S. Treasury securities that have a remaining maturity of greater than 20 years. Eligible securities must be fixed rate, denominated in U.S. dollars, and have $300 million or more of outstanding face value, excluding amounts held by the Federal Reserve. Securities excluded from the Index are inflation-linked securities, Treasury bills, cash management bills, any government agency debt issued with or without a government guarantee and zero-coupon issues that have been stripped from coupon-paying bonds. One cannot directly invest in an index.
Direxion Shares Risks – An investment in a Fund involves risk, including the possible loss of principal. A Fund is non-diversified and includes risks associated with the Fund’s concentrating its investments in a particular industry, sector, or geography which can increase volatility. The use of derivatives such as futures contracts and swaps are subject to market risks that may cause prices to fluctuate over time.
Leverage Risk – Each Fund obtains investment exposure in excess of its net assets by utilizing leverage and may lose more money in market conditions that are adverse to its investment objective than a fund that does not utilize leverage. A total loss may occur in a single day. Leverage will also have the effect of magnifying any differences in the Fund’s correlation or inverse correlation with the Index and may increase the volatility of the Fund.
Daily Index Correlation Risk – A number of factors may affect the Bull Fund’s ability to achieve a high degree of correlation with the Index and therefore achieve its daily leveraged investment objective. The Bull Fund’s exposure to the Index is impacted by the Index’s movement. Because of this, it is unlikely that the Bull Fund will be perfectly exposed to the Index at the end of each day. The possibility of the Bull Fund being materially over- or under-exposed to the Index increases on days when the Index is volatile near the close of the trading day.
Daily Inverse Index Correlation Risk – A number of factors may affect the Bear Fund’s ability to achieve a high degree of inverse correlation with the Index and therefore achieve its daily inverse leveraged investment objective. The Bear Fund’s exposure to the Index is impacted by the Index’s movement. Because of this, it is unlikely that the Bear Fund will be perfectly exposed to the Index at the end of each day. The possibility of the Bear Fund being materially over- or under-exposed to the Index increases on days when the Index is volatile near the close of the trading day.
U.S. Government Securities Risk – A security backed by the U.S. Treasury or the full faith and credit of the United States is guaranteed only as to the timely payment of interest and principal when held to maturity. The market prices for such securities are not guaranteed and will fluctuate.
Oracle Corporation Investing Risk— ORCL faces the risks of difficulties developing and selling new products; artificial intelligence may not operate as expected; inability to execute strategies, especially those related to the cloud structure; inability to secure data center capacity; products and services may not function properly; among other risks.
Information Technology Sector Risk — The value of stocks of information technology companies and companies that rely heavily on technology is particularly vulnerable to rapid changes in technology product cycles, rapid product obsolescence, government regulation, and competition, both domestically and internationally, including competition from competitors with lower production cost.
Software Industry Risk — Companies that develop and implement computer software can face risks associated with intense competition, especially in new product development, deployment and delivery, product obsolescence or saturation, cybersecurity risks as well as changes in regulation especially with respect to consumer or customer data, and risks associated with technology.
Additional risks of each Fund include Effects of Compounding and Market Volatility Risk, Market Risk, Counterparty Risk, Rebalancing Risk, Intra-Day Investment Risk, Other Investment Companies (including ETFs Risk), Cash Transaction Risk, Passive Investment and Index Performance Risk and for the Direxion Daily ORCL Bear 1X ETF and the Direxion Daily 20+ Year Treasury Bear 3X ETF, Shorting or Inverse Risk. Please see the summary and full prospectuses for a more complete description of these and other risks of a Fund.
Distributor: ALPS Distributors, Inc.
/Amazon_com%20Inc_%20%20package%20by%20-%20AdrianHancu%20via%20iStock.jpg)
/Salesforce%20Inc%20HQ%20building-by%20JHVEPhoto%20via%20Shutterstock.jpg)

/Dell%20Technologies%20by%20Poetra_RH%20via%20Shutterstock.jpg)
/Intel%20Corp_%20Santa%20Clara%20campus-by%20jejim%20via%20Shutterstock.jpg)