In a November 4, 2025, Barchart article, I asked why the dollar index was stuck in neutral. I concluded the article with the following:
The dollar index is stuck in neutral in early November 2025, but it is consolidating near the low end of its recent trading range. The odds currently favor a continuation of the lower lows and lower highs and bearish trend in place since the high in early 2025.
The dollar index was trading at 99.83 on November 3, 2026, and while it reached a lower low in Q1 2026 at 95.55, the lowest level since Q1 2022, the index was near the 99 level in April 2026. The dollar index rose 1.75% in Q1 2026, closing the quarter at 99.759 on the nearby futures contract.
The dollar index is critical for commodity prices
Since the U.S. dollar has been the world’s reserve currency for years, most commodities worldwide use it as their pricing currency.
A weakening dollar tends to support raw material prices by making them cheaper in other currencies, prompting increased consumption. Conversely, a stronger U.S. currency often weighs on commodity prices, as it makes them more expensive in other currencies. The dollar's level relative to other currencies is only one factor affecting raw material prices. Interest rates, idiosyncratic supply and demand factors, macroeconomic factors, and geopolitics are also critical factors in prices.
A bearish trend since Q3 2022
As the U.S. dollar’s path is one of the factors to consider when forecasting the path of least resistance for commodity prices, commodity traders and analysts watch the dollar index, which measures the dollar’s strength or weakness against other leading reserve currencies.
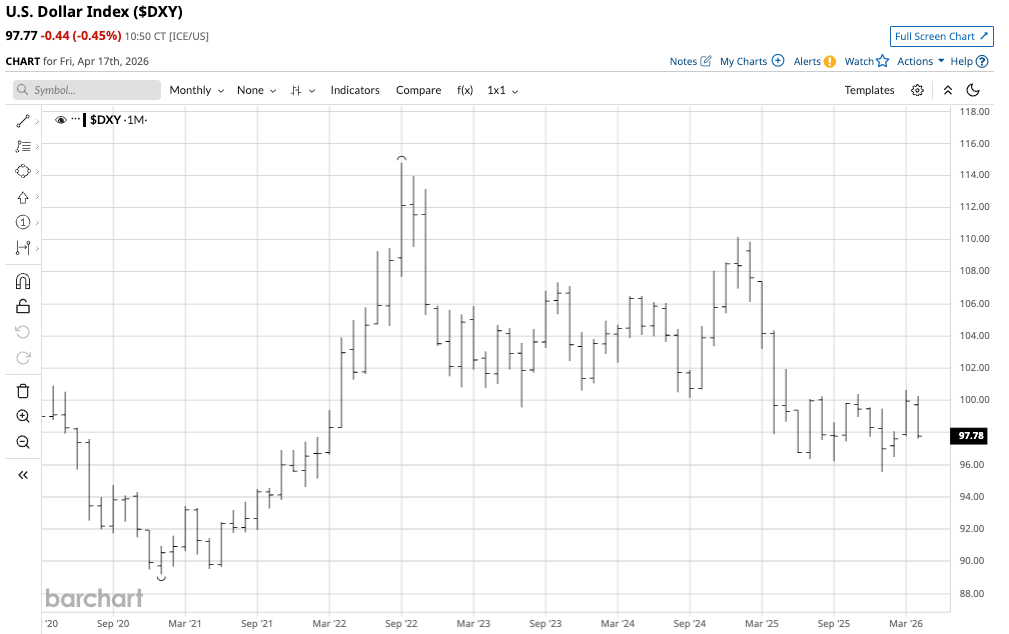
The monthly chart shows that the dollar index reached a peak of 114.78 in September 2022, where it ran out of bullish steam. The index fell 16.75% to its most recent low of 95.55 in January 2026. At just under 97.80, the index remains in a bearish trend, not far above the early 2026 low and the first technical support level.
A bullish trend since Q1 2008
The 20-year monthly chart of the dollar index shows a markedly different technical picture.
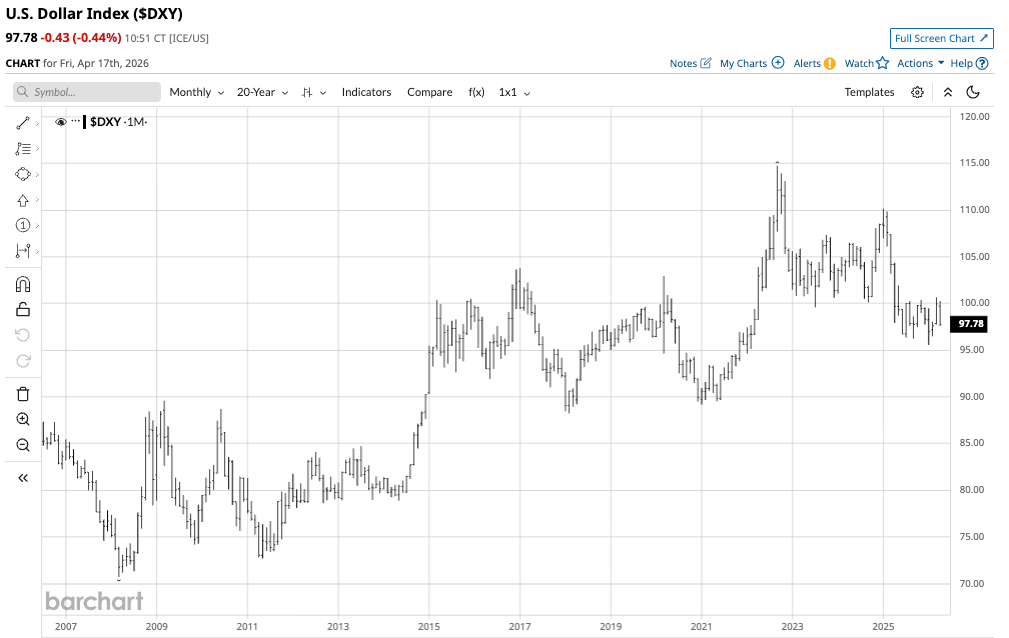
The longer-term chart highlights the bullish pattern of higher lows and higher highs, lifting the index by 62.37% from 70.69 in March 2008 to 114.78 in September 2022. As long as the index remains above the January 2021 low of 89.20, the bullish pattern will remain intact.
A bearish trend since the 1985 high
To further confuse the technical picture, the very long-term trend since the mid-1980s remains bearish.
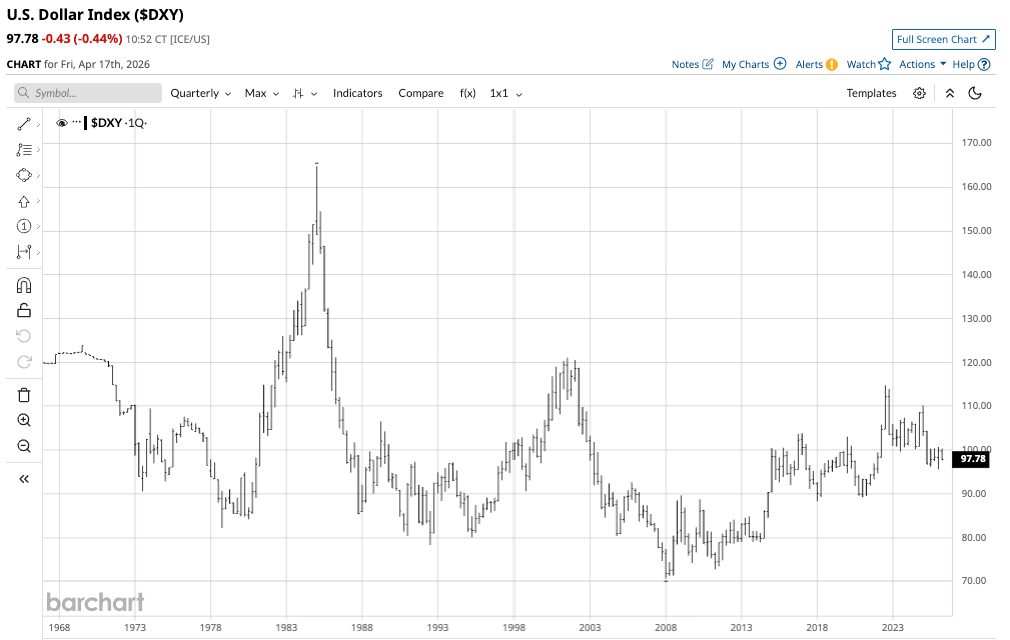
The quarterly chart shows that the index has made lower highs since the Q1 1985 high of 164.72. Critical technical resistance for the long-term bearish trend is at the Q3 2022 high of 114.78.
Interest rates are critical for the index. UUP is the bullish, and UDN is the bearish dollar index ETF products
The path of U.S. interest rate differentials relative to other dollar index components, primarily the euro, is a critical factor in determining the dollar index’s path of least resistance. At the 98 level, technical support is at the early 2021 low of 89.20, with resistance at the 2022 high of 114.78. The midpoint at around 102 is slightly above the current level.
The global trend of de-dollarization, driven by U.S. tariffs and sanctions, could be a bearish factor. Meanwhile, the dollar’s status as the world’s reserve currency, which tends to rally during periods of geopolitical and global economic turmoil, is a bullish factor. With bullish and bearish factors pulling the dollar index in opposite directions, the index is likely to remain within the support and resistance levels, making fading any significant moves an optimal and logical approach.
The most direct route for a risk position in the dollar index is the futures and futures options on the Intercontinental Exchange. The Invesco DB U.S. Dollar Index Bullish Fund (UUP) tracks the index, while its converse ETF, the Invesco DB U.S. Dollar Index Bearish Fund (UDN), moves higher when the index falls and vice versa.
At $27.21 per share, UUP had over $413.2 million in assets under management. UUP trades an average of over 3.26 million shares per day and charges a 0.70% management fee. The latest rally in the dollar index lifted it by 5.33% from 95.55 on January 27, 2026, to 100.64 on March 31, 2026.
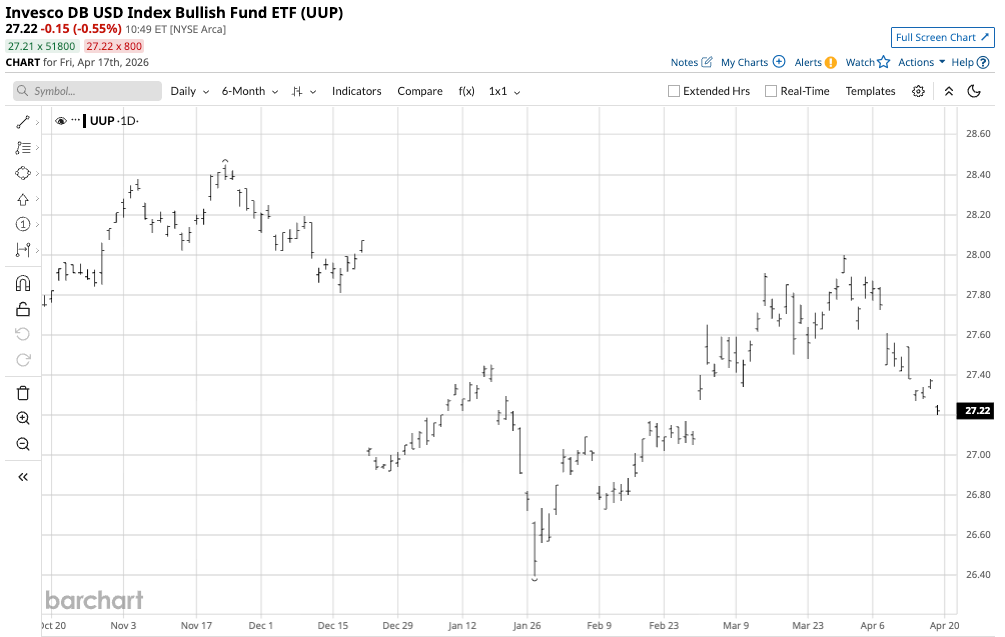
The chart shows that over the same period, UUP rose 6.1%, from $26.39 to $28.00 per share.
At $18.41 per share, UDN had over $145.7 million in assets under management. UDN trades an average of over 180,000 shares per day and charges a 0.68% management fee. The latest decline in the dollar index took it 2.99% lower from 100.64 on March 31, 2026, to 97.63 on April 17, 2026.
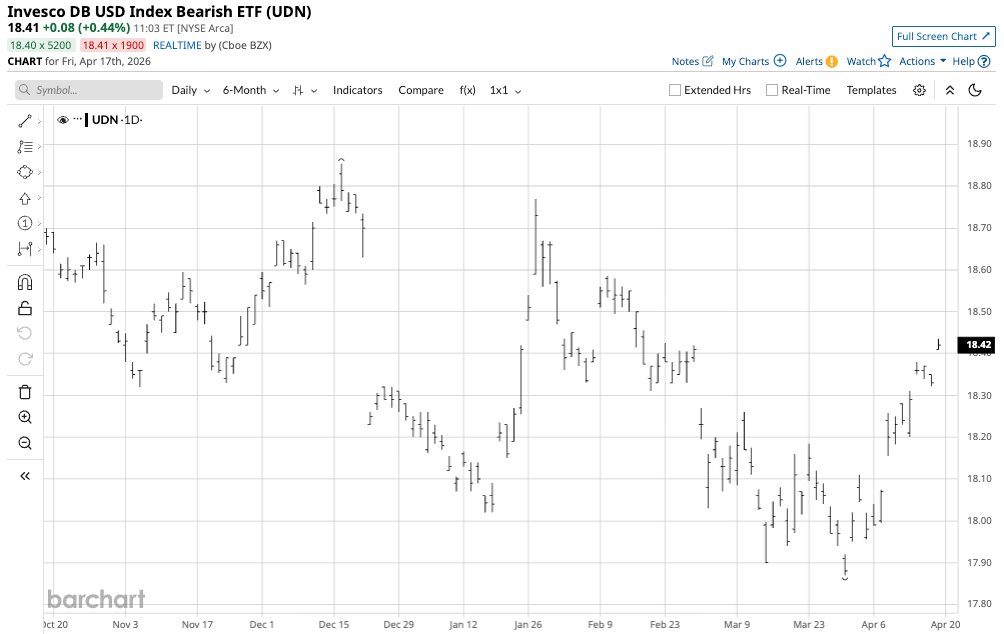
The chart shows that over the same period, UDN rose 3.13%, from $17.87 to $18.43 per share.
UUP and UDN are liquid ETFs that track the dollar index on both the upside and the downside. As the dollar index is likely to remain within its trading range, fading significant moves using the UUP and UDN ETFs could be optimal over the coming months.
While the dollar index could be heading for lower lows, it is likely to remain within the 89.20-114.78 range over the coming months.
On the date of publication, Andrew Hecht did not have (either directly or indirectly) positions in any of the securities mentioned in this article. All information and data in this article is solely for informational purposes. For more information please view the Barchart Disclosure Policy here.

/A%20close-up%20of%20a%20SpaceX%20sign%20by%20Sundry%20Photography%20via%20Adobe%20Stock.jpeg)
/Green%20hydrogen%20by%20Scharfsinn%20via%20Shutterstock.jpg)
/Abbvie%20Inc%20HQ%20photo-by%20vzphotos%20via%20iStock.jpg)
