
Soybeans, Corn & Wheat Outlook 4/16/26
These are the May contracts, we have moved into the July now, however you can see on the charts all the Fibonacci retracements and major Gann squares that have turned each market.
There are two methods we use at ONE44 to find support and resistance in the markets. The first are major Gann squares, these are the yellow horizontal lines on the chart. The second is Fibonacci retracements.
The charts are key to this analysis.
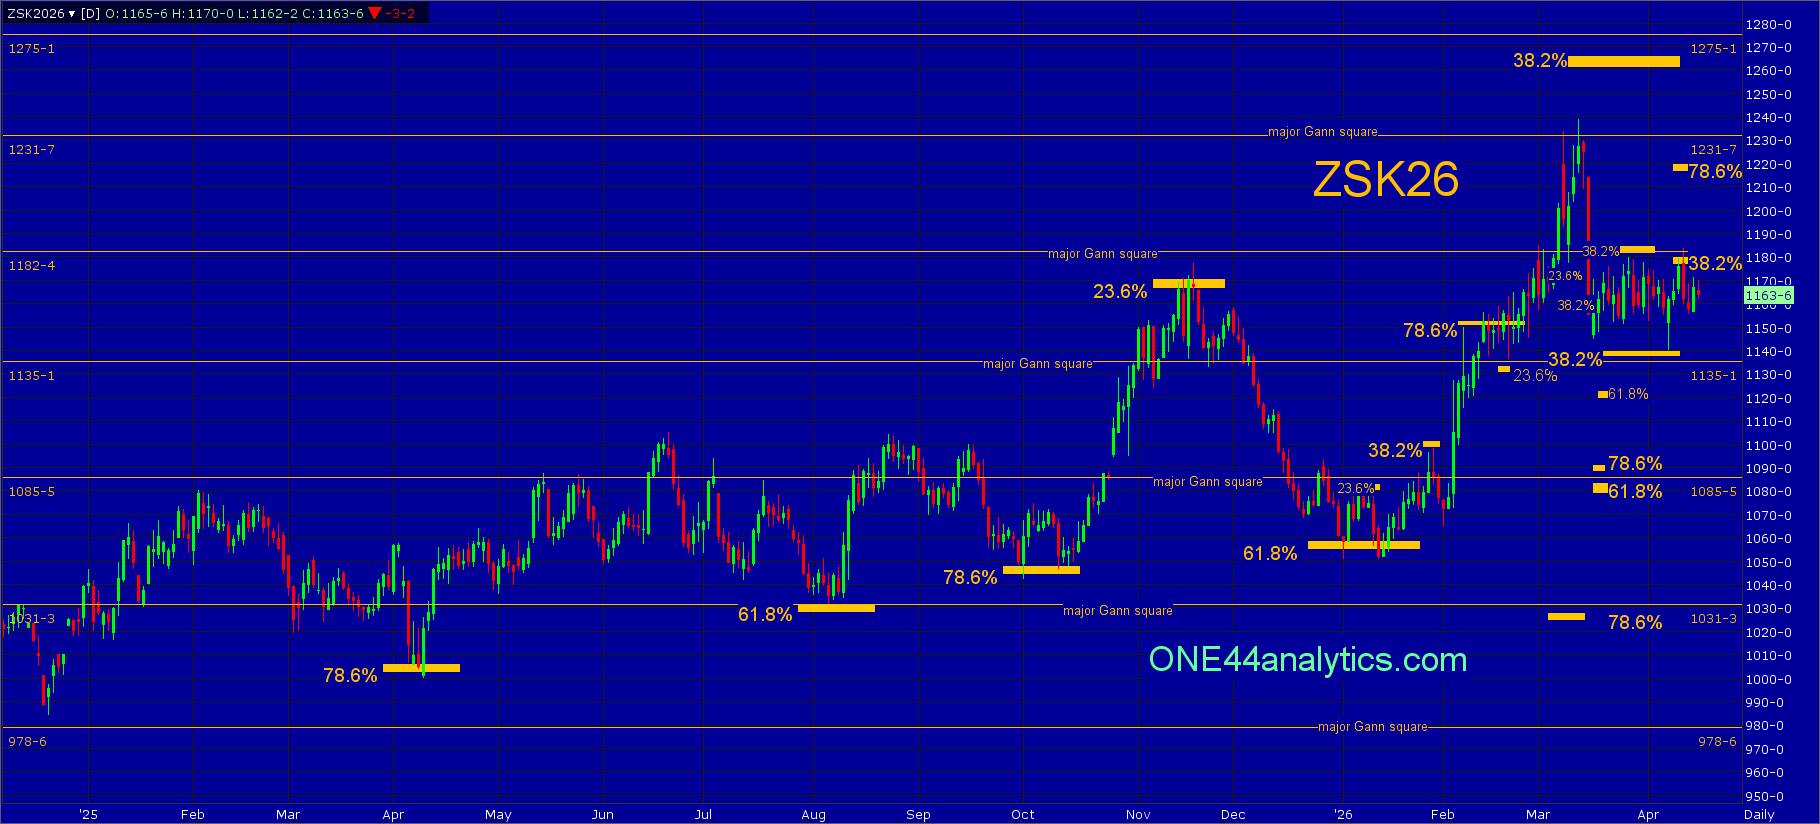
Soybeans
May
From last week,
The break this week held above 38.2% at 1139.00 (1140.50 low) keeping the longer term trend positive and a run at new highs possible, this will be the key level for the week. It will still need to take out 38.2% back to the 3/12/26 at 1177.50 to turn the short term trend positive.
Use 1139.00 as the swing point for the week.
Above it, the short term target area is 38.2% at 1177.50 and the 1182.50 major Gann square, a failure to get above this area after holding the longer term 38.2% at 1139.00 would not be a good sign and a new low can quickly follow. The longer....
The rally after holding 38.2% at 1139.00 hit the short term target area of 38.2% back to the 3/12/26 high at 1177.50 and the 1182.50 major Gann square. The longer term trend remains positive above 1139.00, however the short term downtrend from the 3/12/26 high is still negative until it can take out 38.2% at 1177.50 and this will be the key level for the week.
Use 1177.50 as the swing point for the week.
Above it, the short term trend turns positive and the short term target is 78.6% of the same move at 1217.00. The long term target is also the long term swing point at 1261.00, this is 38.2% on the continuation chart.
Below it, the short term target area is 1139.00 (38.2%) and the 1135.00 major Gann square, a failure to hold this area turns the long term trend negative. The longer term target area is 1091.00 to 1083.00, this is 78.6% back to the 1/13/26 low, a major Gann square and 61.8% back to the contract low. The long term target area is the 1031.25 major Gann square and 78.6% back to the contract low at 1027.00.
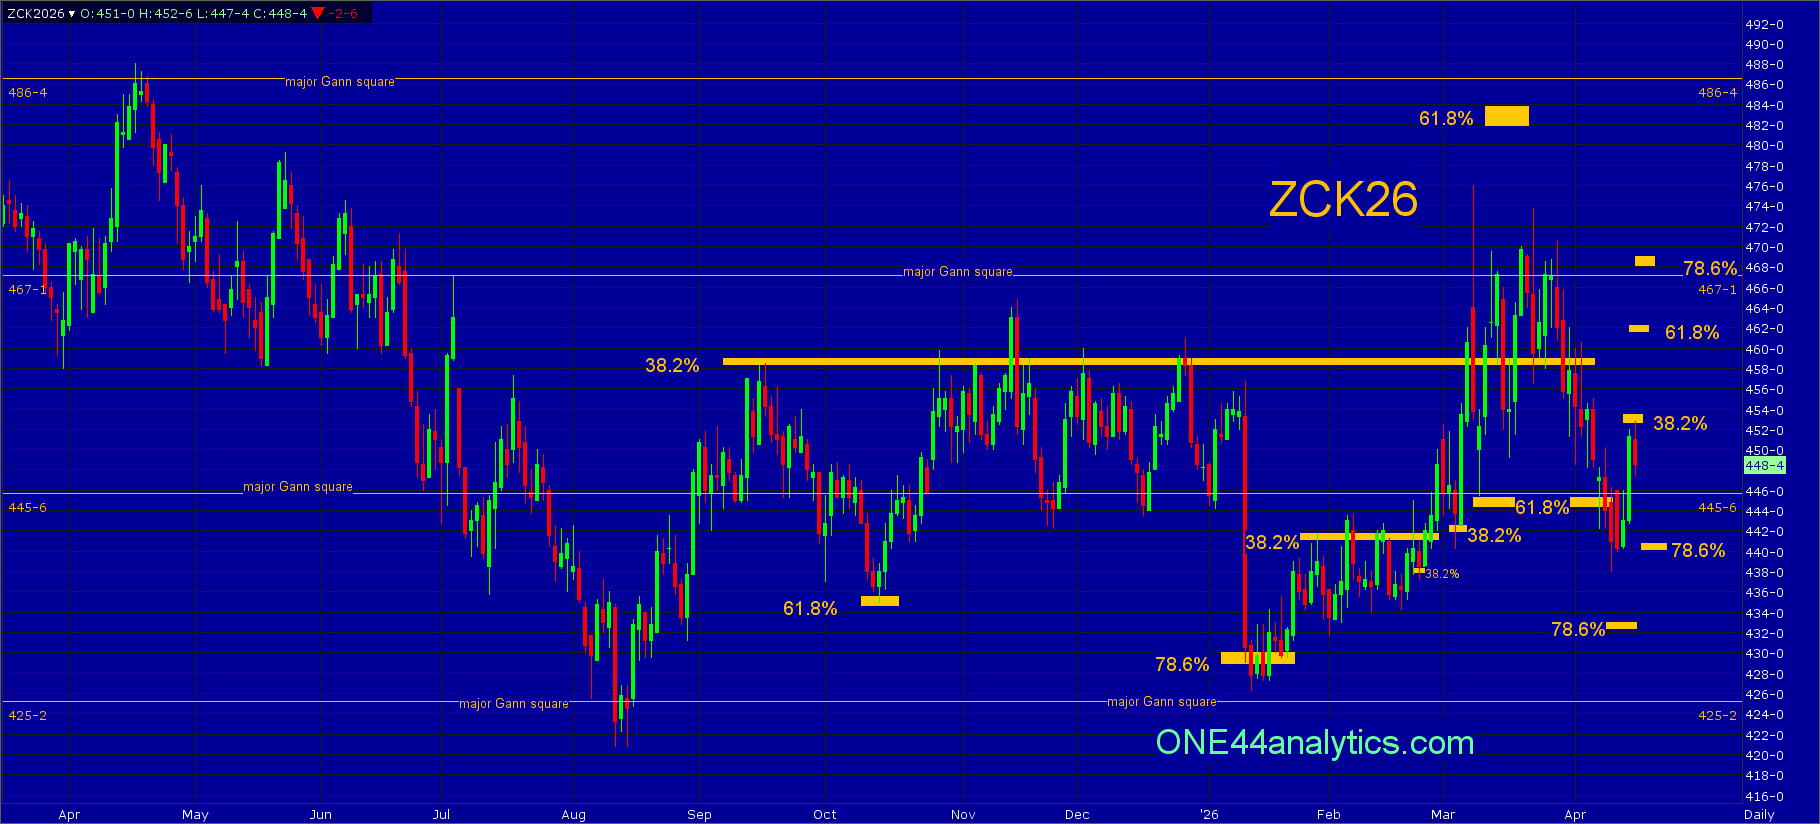
Corn
May
From last week,
The break this week from the 459.00 (38.2%) swing point hit the short term target of 445.75, this was a major Gann square and 61.8% and this will be the key level for the week. It is currently trading below it, provided it can get right back above it the short term target will be 61.8% the other way per the ONE44 61.8% rule.
Use 445.75 as the swing point for the week.
Above it,..... Any rally that can't get above 38.2% at 455.00 would be a negative sign and a new low can quickly follow.
The market took out the 445.75 swing point and made a new low for the current downtrend and that lowered the 38.2% back to the 3/9/26 high to 452.50, it hit this today and it will be the key level for the week. A failure to get above this level can send this market to a new low (ONE44 38.2% rule).
Use 452.50 as the swing point for the week.
Above it, turns the short term trend positive and the short term target is 61.8% of the same move at 461.50. The long term target area is the 467.00 major Gann square and 78.6% at 468.00.
Below it, keeps the short term trend negative and a new low is possible. The short term target is 78.6% back to the 4/10/26 low at 441.00, a failure to make a new low in this area can be the start of the next leg up, per the ONE44 78.6% rule. The long term target is 78.6% back to the contract low at 433.00, a failure to turn higher from this area will give us only major Gann squares to look for support and then use as the swing point when closed below, the next two are 425.25 and 406.50.
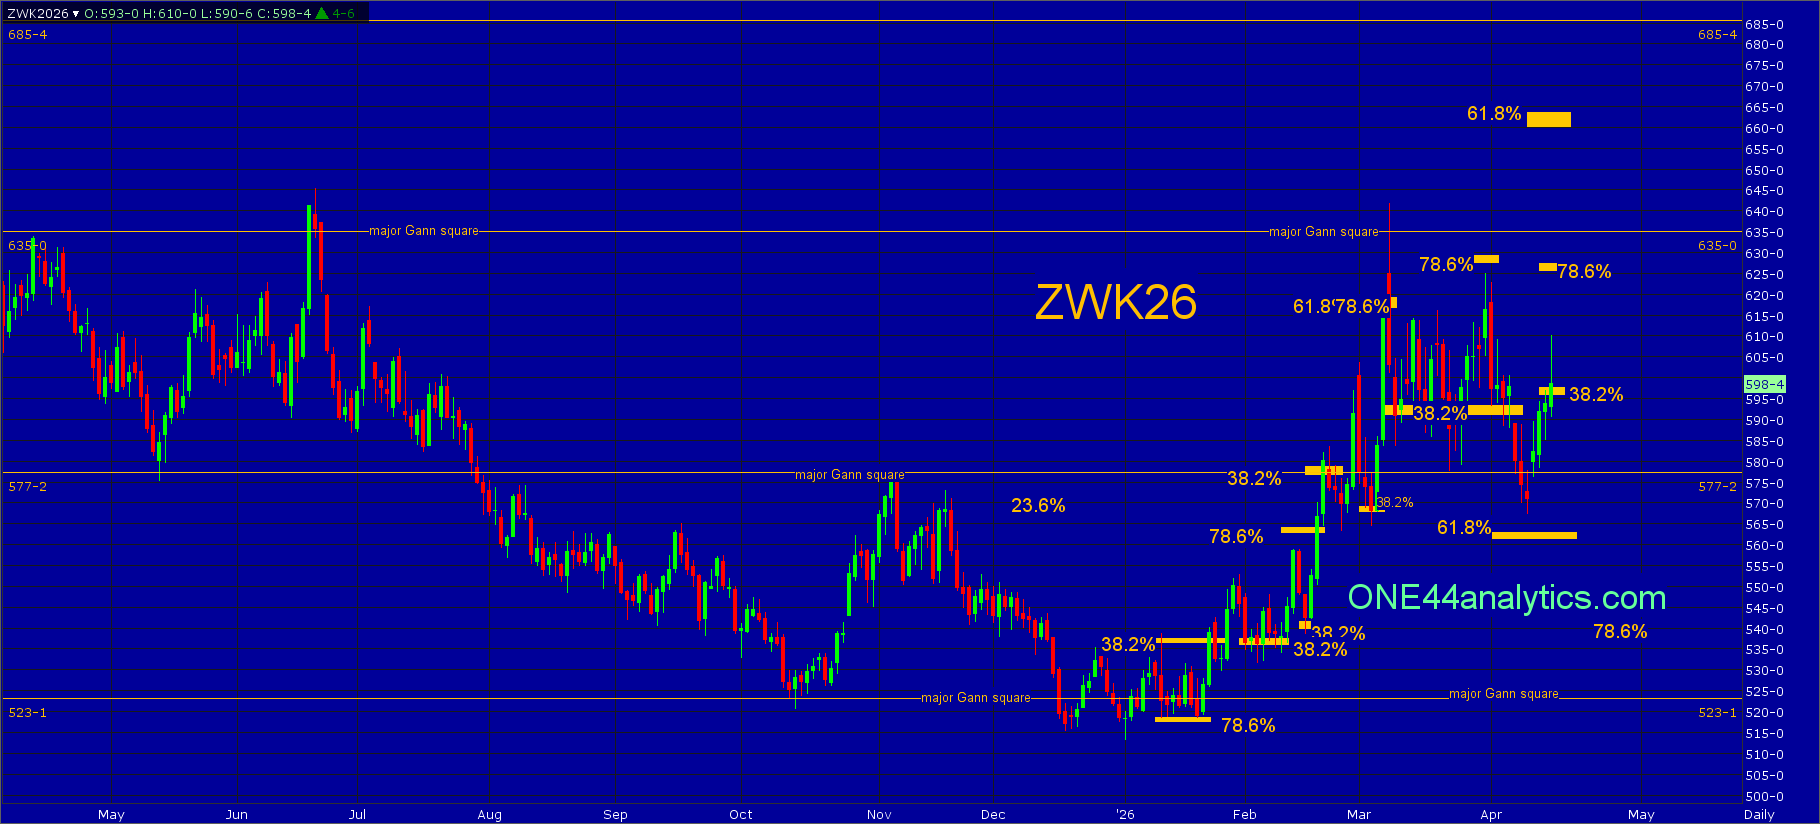
Wheat
May
From last week,
A failure to make the new high on 3/31/26 in the area of a 78.6% retracement did cause a sharp selloff that has now taken out 38.2% at 593.00 turning the longer term trend negative and closed below the 577.25 major Gann square and this will be the key level for the week.
Use 577.25 as the swing point for the week.
It had one more close below the 577.25 major Gann square and swing point for the week and it now has 4 closes above it. It also took out the reset 38.2% retracement above with the new low at 596.00 and this will be the key level for the week.
Use 596.00 as the swing point for the week.
Above it, keeps the short term trend positive and short term target is 78.6% back to the 3/9/26 high at 627.00. The longer term target is 61.8% back to the contract high at 660.00. The long term target is 23.6% back on the continuation chart at 703.00.
Below it, the short term trend is 61.8% back to the contract low at 563.00. The long term target is 78.6% of the same move at 541.50. A failure to turn higher from this area will give us only major Gann squares to look for support and then use as the swing point when closed below, the next one is 523.00.
ONE44 Analytics where the analysis is concise and to the point
Our goal is to not only give you actionable information, but to help you understand why we think this is happening based on pure price analysis with Fibonacci retracements, that we believe are the underlying structure of all markets and Gann squares.
If you like this type of analysis and trade the Grain/Livestock futures you can become a Premium Member.
You can also follow us on YouTube for more examples of how to use the Fibonacci retracements with the ONE44 rules and guidelines.
FULL RISK DISCLOSURE: Futures trading contains substantial risk and is not for every investor. An investor could potentially lose all or more than the initial investment. Commission Rule 4.41(b)(1)(I) hypothetical or simulated performance results have certain inherent limitations. Unlike an actual performance record, simulated results do not represent actual trading. Also, since the trades have not actually been executed, the results may have under- or over-compensated for the impact, if any, of certain market factors, such as lack of liquidity. Simulated trading programs in general are also subject to the fact that they are designed with the benefit of hindsight. No representation is being made that any account will or is likely to achieve profits or losses similar to those shown. Past performance is not necessarily indicative of future results.
/Microsoft%20logo%20on%20building%20by%20franz12%20via%20iStock.jpg)


/NVIDIA%20Corp%20logo%20outside%20building-by%20BING-JHEN_HONG%20via%20iStock.jpg)
/Super%20Micro%20Computer%20Inc%20HQ%20photo-by%20Tada%20Images%20via%20Shutterstock.jpg)