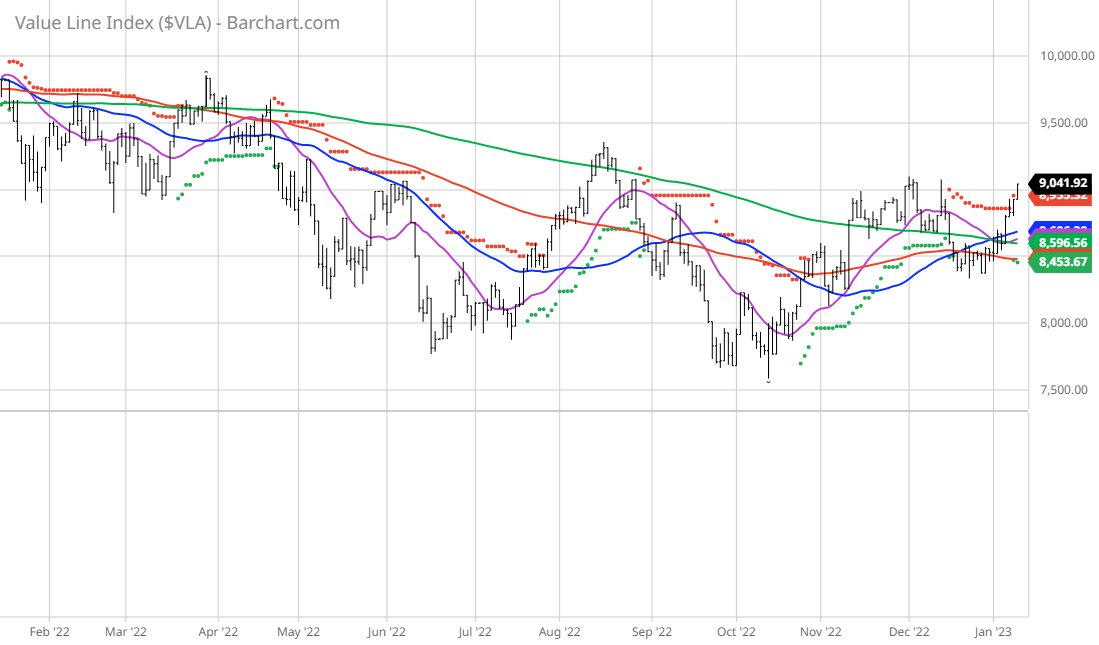
The Chart of the Day belongs to the Value Line Arithmetic Index $VLA . I use this as my stock market benchmark because it is an unweighted index using the largest 1700 stocks, roughly the equivalent of the S&P 500 large cap, S&P 400 mdi cap and S&P 600 small cap indices combined but unweighted. Look at the chart and you can see the Index is above its 20,50,100,and 200 day moving averages.
Barchart's Opinion Trading systems are listed below. Please note that the Barchart Opinion indicators are updated live during the session every 20 minutes and can therefore change during the day as the market fluctuates. The indicator numbers shown below therefore may not match what you see live on the Barchart.com website when you read this report.
Barchart Technical Indicators:
- 72% technical buy signals
- negative 3.00 Weighted Alpha
- 8.68% loss in the last year
- Trend Seeker buy signal
- Above its 20, 50 and 100 day moving averages
- 2 new highs and up 4.06% in the last month
- Relative Strength Index 64.49%
- Recently traded at 9,041.92 with 50 day moving average of 8,686.38
Barchart's Market Performance Indicator (uses 5,270 stocks) is signaling the same upward momentum -
Market Performance Indicator
Barchart Market Momentum Index ($BCMM) [+0.08%] is an exclusive index used as an indicator of change in overall markets. It reflects the movement of stocks who fit the following criteria: must have current SEC filings, must have traded for a minimum of 6-months, and must be trading above $2.
MARKET AVERAGE
The percentage of stocks in $BCMM above their individual Moving Average per period.
| 5-Day MA | 20-Day MA | 50-Day MA | 100-Day MA | 150-Day MA | 200-Day MA | |
|---|---|---|---|---|---|---|
| Today | 84.02% | 85.54% | 70.38% | 65.70% | 58.87% | 51.90% |
| Yesterday | 82.34% | 81.55% | 64.57% | 61.31% | 55.57% | 49.37% |
| Last Week | 51.10% | 47.98% | 40.58% | 44.45% | 42.87% | 38.62% |
| Last Month | 64.69% | 47.34% | 59.72% | 51.17% | 50.22% | 44.01% |
When the majority of the stocks are trading above all their 5,20,50,100,150 and 200 daily moving averages you should not be sitting on the sidelines. Look at the stocks trading above their daily moving averages and decide which are the right ones for you.
Additional disclosure: The Barchart Chart of the Day highlights stocks that are experiencing exceptional current price appreciation. They are not intended to be buy recommendations as these stocks are extremely volatile and speculative. Should you decide to add one of these stocks to your investment portfolio it is highly suggested you follow a predetermined diversification and moving stop loss discipline that is consistent with your personal investment risk tolerance and reevaluate your stop losses at least on a weekly basis.
On the date of publication, Jim Van Meerten did not have (either directly or indirectly) positions in any of the securities mentioned in this article. All information and data in this article is solely for informational purposes. For more information please view the Barchart Disclosure Policy here.


/A%20close-up%20of%20a%20General%20Motors%20corporate%20sign%20by%20lindaparton%20via%20Adobe%20Stock.jpeg)

/Delta%20Air%20Lines%2C%20Inc_%20passanger%20plane-by%20viper-zero%20via%20iStock.jpg)