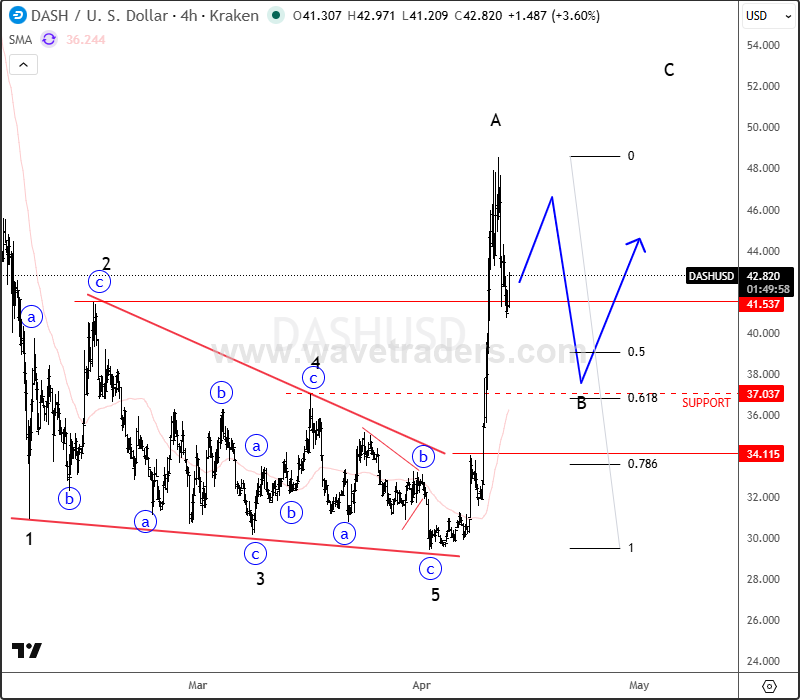
Dash is showing early signs of a bullish reversal on the 4-hour chart after completing a classic ending diagonal (wedge) pattern, often associated with trend exhaustion and sharp reversals.
Price action has already responded with an impulsive move higher, suggesting the formation of wave A. This initial recovery indicates renewed buying interest and opens the door for further upside in the near term.
www.wavetraders.com
However, from an Elliott Wave perspective, the market may first undergo a corrective pullback in wave B. This phase could provide a healthy retracement, with key support seen around the 37 level. A retest of this zone would not only validate the structure but also potentially offer a more favorable entry point.
Following the completion of wave B, the next expected move is a continuation higher in wave C, which could extend the current bullish momentum and confirm a broader short-term trend reversal.
Traders should monitor price behavior around support closely, as holding above this region would strengthen the bullish outlook and increase the probability of further gains.
For a detailed view and more analysis like this, you can watch below our latest recording of a live webinar streamed on April 13:


/Apple%20Inc%20logo%20on%20Apple%20store-by%20PhillDanze%20via%20iStock.jpg)
/Visa%20Inc%20gold%20card-by%20hatchpong%20via%20iStock.jpg)