Cotton futures trade on the Intercontinental Exchange (ICE) in the “soft” sector of the commodities asset class. Aside from cotton, the other softs include sugar, coffee, cocoa, and frozen concentrated orange juice futures. Since the weather in critical growing areas is the primary factor for the path of least resistance of cotton and other soft commodity prices, the sector can experience extreme volatility as Mother Nature’s wrath can create shortages, leading to explosive rallies. Alternatively, bumper crops can cause prices to plunge.
Cotton’s April 2020 low came as the global pandemic gripped markets across all asset classes. The subsequent rally occurred as worldwide inflationary pressures grew, and supply chain issues challenged cotton producers and consumers. Since April 2020, the cotton market moved from a price implosion to an explosion that took the price to the highest level since 2011 before running out of upside steam, correcting, and consolidating around the 80 cents per pound level in December 2022. The iPath Series B Cotton Subindex TR ETN (BAL) moves higher or lower with cotton futures prices.
Correction and consolidation
After reaching a $1.5802 per pound high in May 2022, cotton prices corrected and more than halved in value at the October 2022 low.
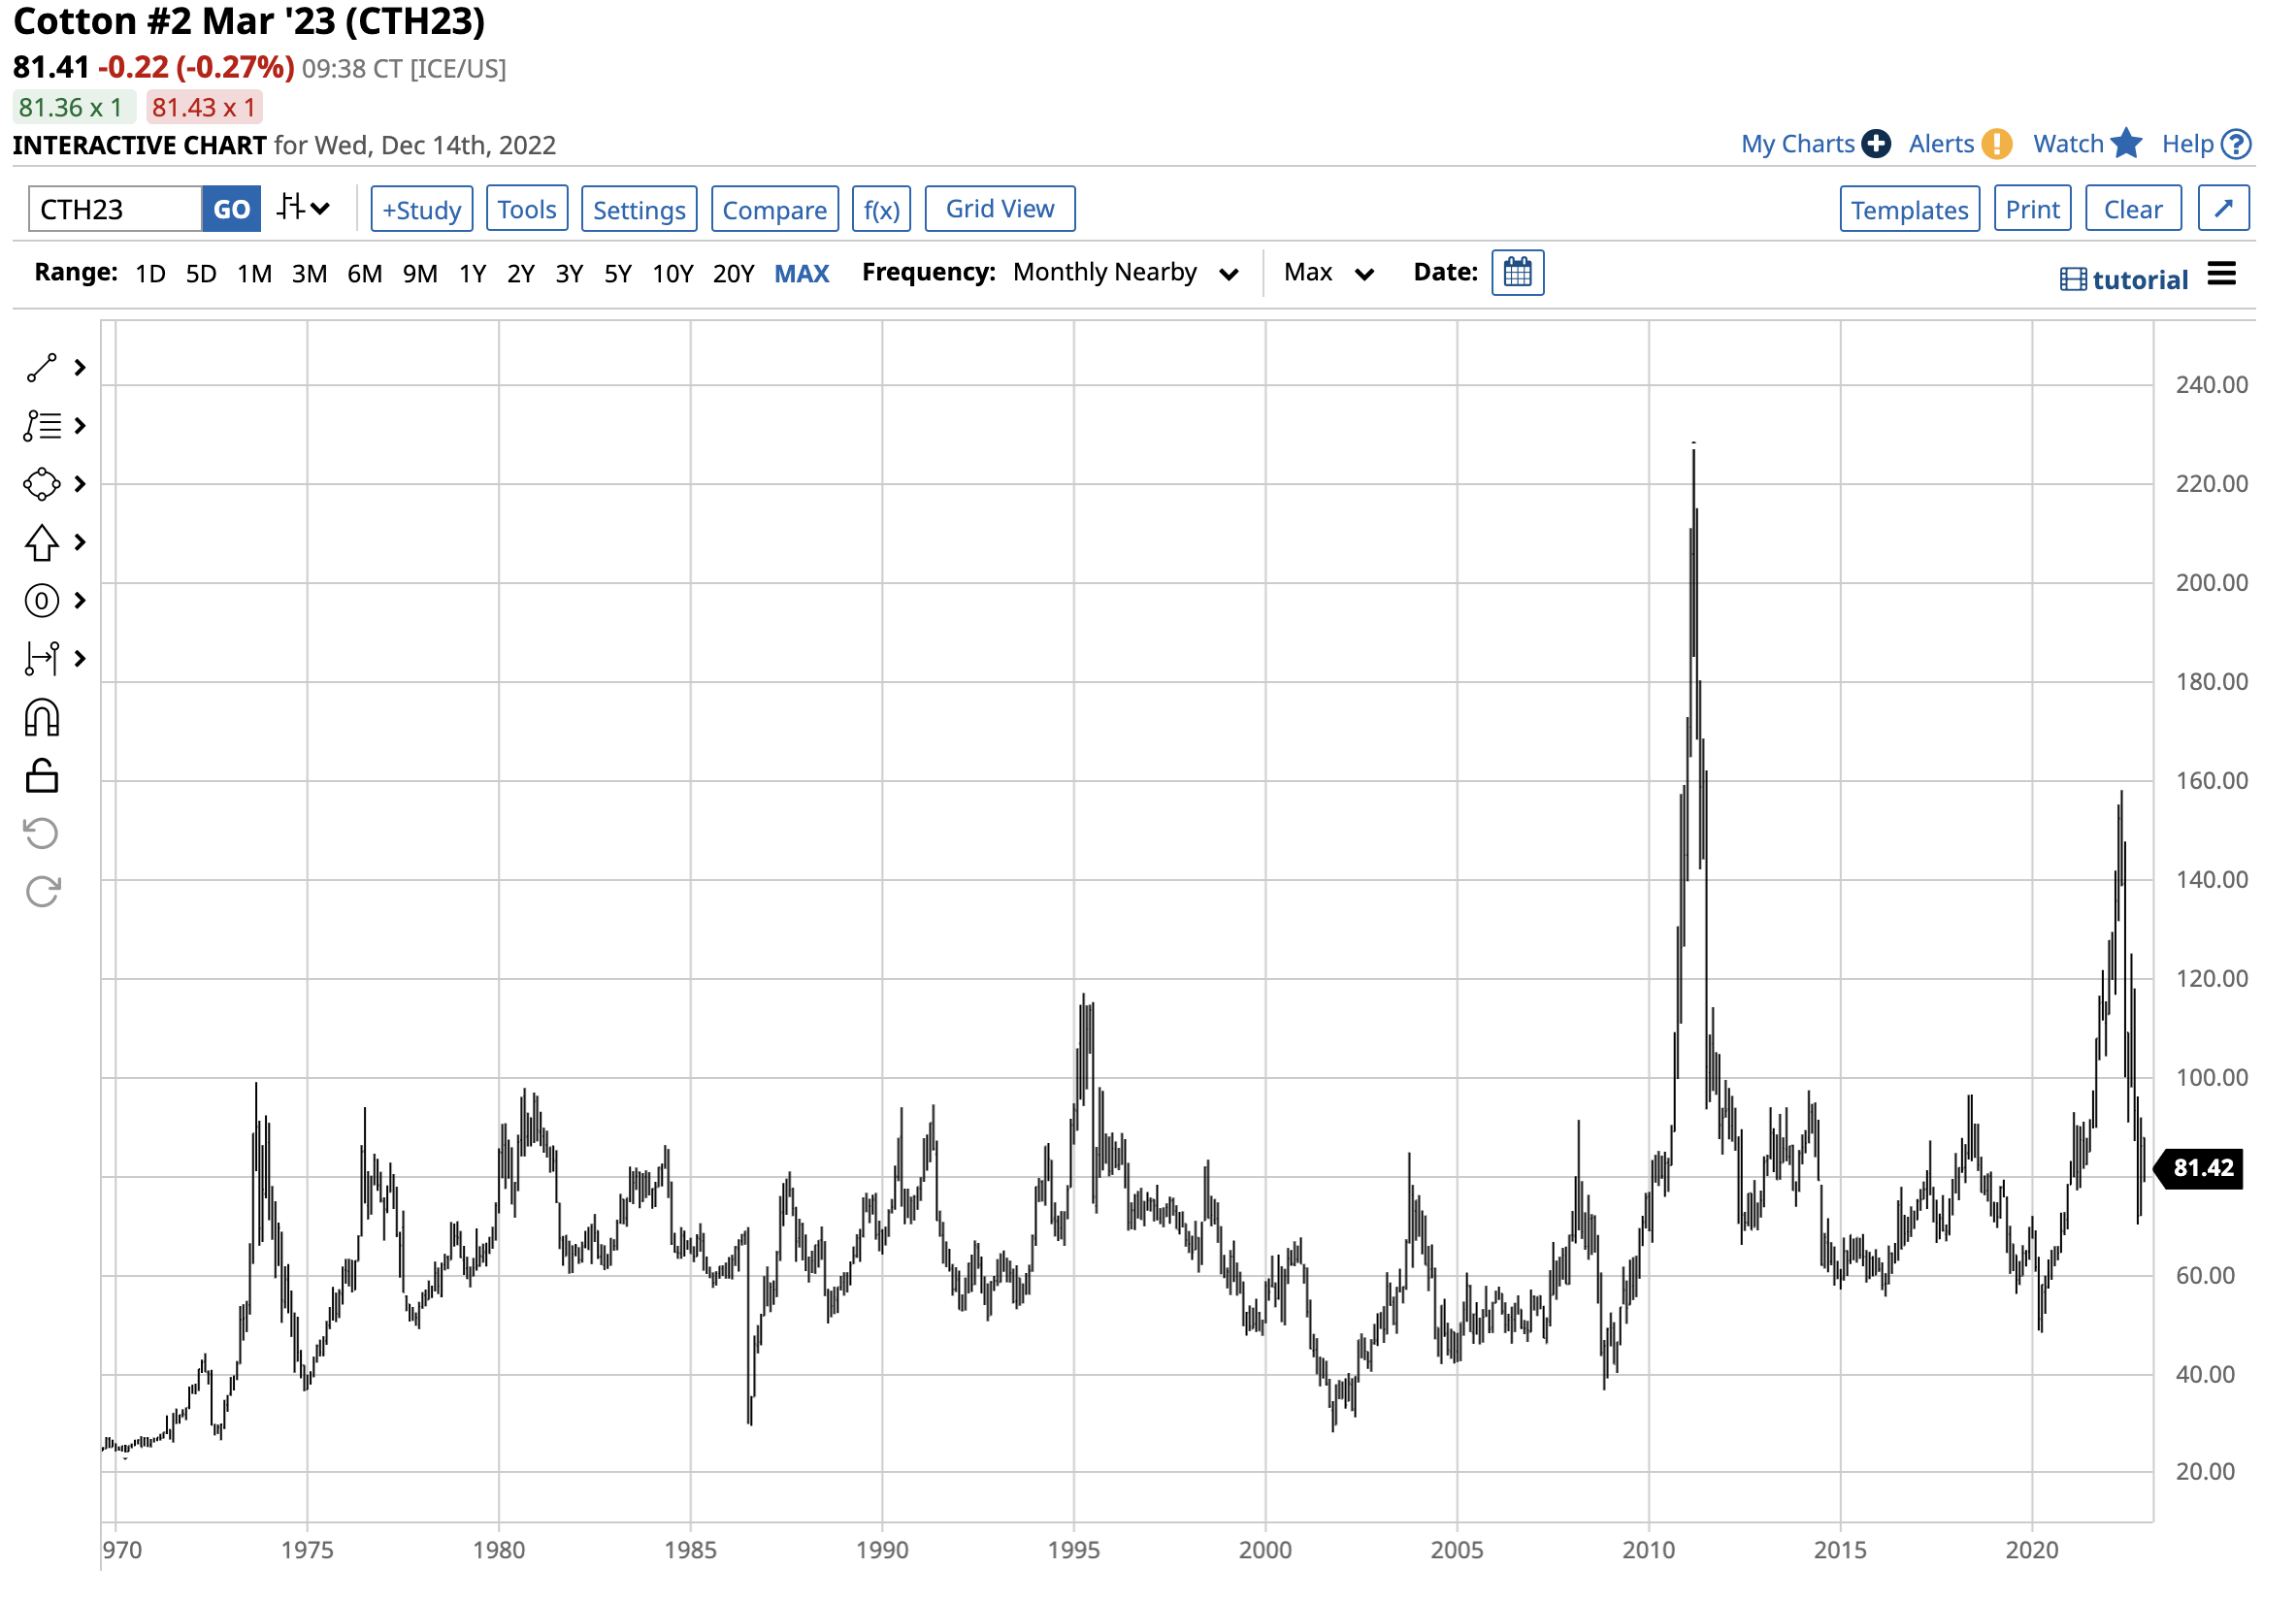
The long-term chart dating back to the late 1960s highlights cotton futures traded to the highest price since 2011, when the fluffy fiber futures reached $2.27 per pound, a record peak. In October 2022, the most recent correction found a bottom at 70.21 cents per pound, a 55.6% decline from the May 2022 high.
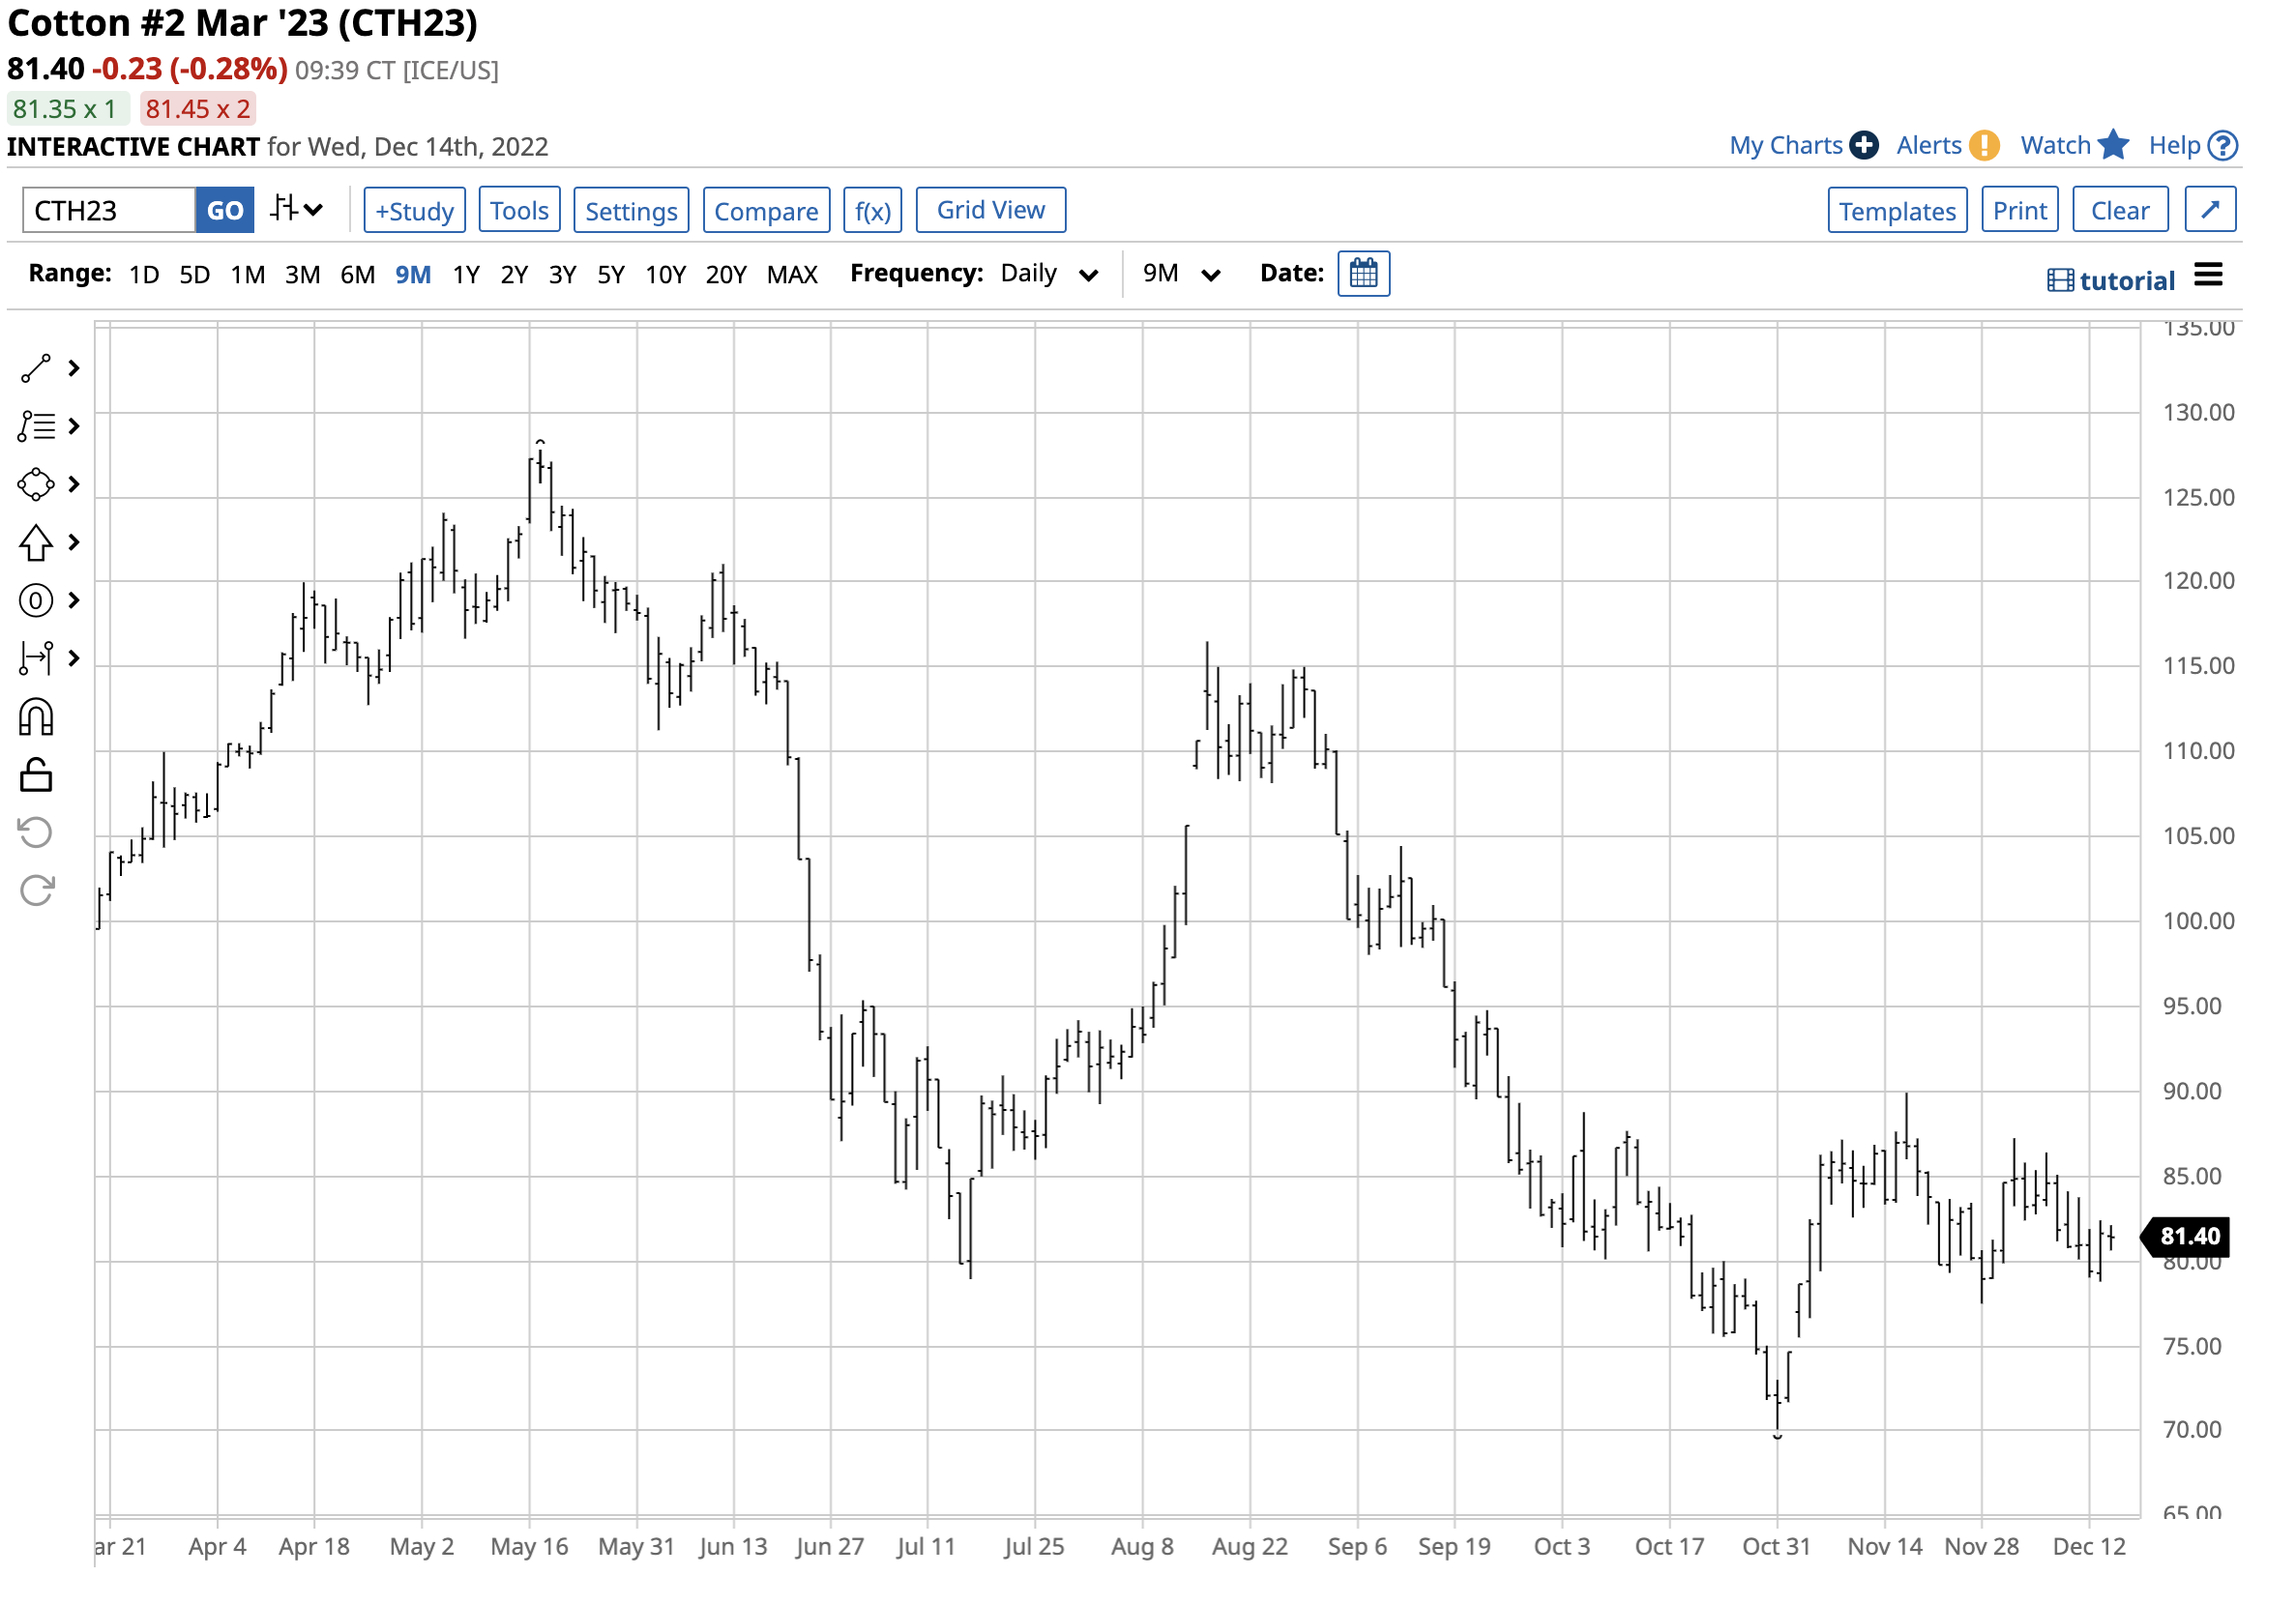
The active month March 2023 futures contract chart shows that after falling to 70.10 cents in October, March cotton futures have consolidated between 77.50 and just below 90.0 cents per pound since early November.
In a Barchart article in late November, I highlighted that cotton futures tend to peak during the spring. The market will likely have to wait until the first half of 2023 for any significant recovery rally.
The leading cotton-producing countries
In 2022, China and India remained the leading cotton-producing countries, with the U.S. output half the level of the two leaders.
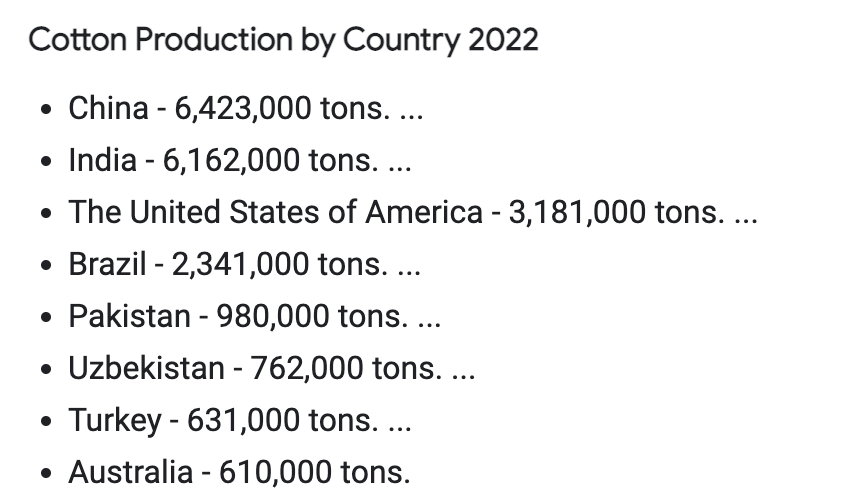
Source: worldpopulationreview.com
While the weather and growing conditions in China and India are the most critical factors for the path of least resistance of cotton prices each year, the U.S. is the world’s swing producer.
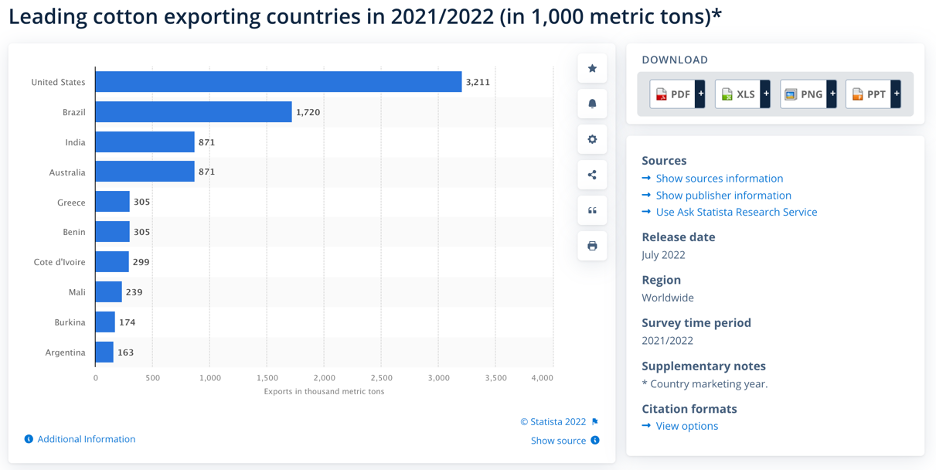
Source: statista.com
The chart shows the world’s third and fourth top cotton-producing countries, the U.S. and Brazil, and the leading exporters. Therefore, in years when Chinese and Indian cotton crops decline, the U.S. and Brazil become more critical factors for worldwide cotton prices.
The top cotton-consuming countries
Cotton is a leading input in garment manufacturing, and the countries that consume the most fiber annually typically have the lowest labor costs.
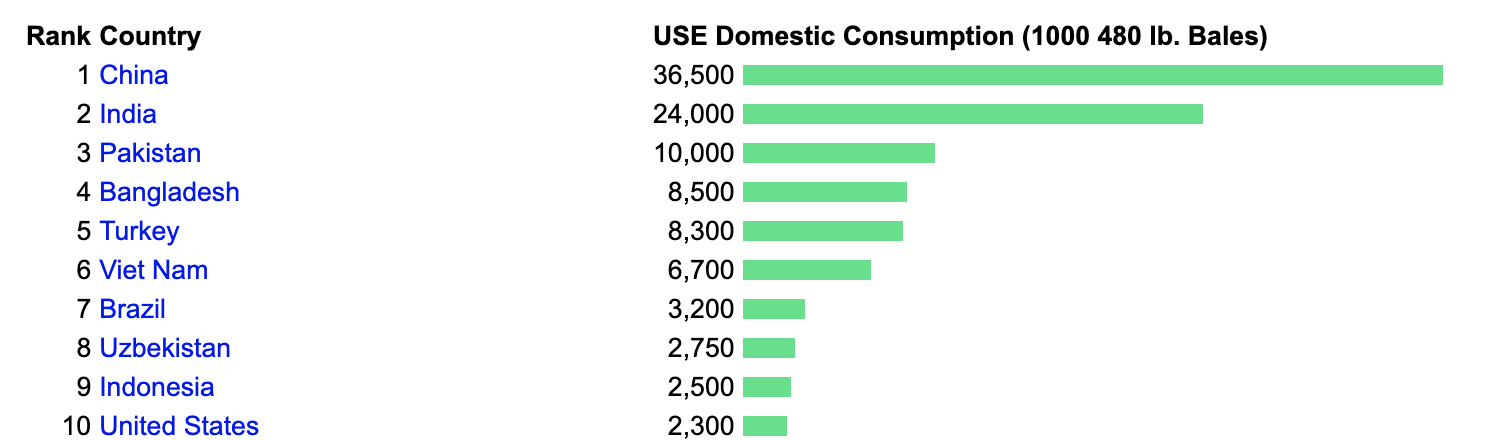
Source: Index Mundi
The chart highlighting cotton consumption in 2022 shows that China, India, Pakistan, Bangladesh, Turkey, and Viet Nam are the leading consumers. When Chinese and Indian production decline, these countries turn to the U.S., Brazil, and Australia for supplies.
The fundamentals from the latest WASDE Report
On December 9, the U.S. Department of Agriculture released its final World Agricultural Supply and Demand Estimates Report for 2022. The WASDE told the cotton market:
This month’s 2022/23 U.S. cotton forecasts include higher production and ending stocks but lower mill use and exports. Production is 211,000 bales higher—at 14.2 million bales—mainly due to higher yields in the Delta and Southeast. Mill use is lowered 100,000 bales reflecting reduced spinning levels to date and weaker expectations for future demand. A reduction in expected world demand and trade results in a 250,000-bale decrease for U.S. cotton exports, down to 12.25 million. Ending stocks are now expected to be 500,000 bales higher than they were a month earlier, but the upland cotton season-average farm price is unchanged at 85 cents per pound. The global 2022/23 cotton forecasts include lower production, consumption, and trade, but higher ending stocks. Production is down 700,000 bales from the previous month’s forecast, led by an 800,000-bale decline in Pakistan’s flood-damaged crop. Australian production is estimated 500,000 bales lower, and Mali’s crop is reduced 120,000 bales. Higher than expected yields in Turkey resulted in a 500,000-bale upward revision. Global consumption is down 3.3 million bales from the previous month, and on a year-to-year basis world cotton use is now projected to decline 4.9 percent, similar to the decline experienced in 2021/22. This month’s changes to 2022/23 consumption include 1.0-million-bale reductions for China and India, and smaller reductions for Pakistan, Turkey, and Vietnam. Projected world trade is cut 950,000 bales this month, with imports reduced for China, Turkey, and Vietnam. Exports are reduced for Australia, Mali, Malaysia, India, and Brazil. World ending stocks are projected 2.3 million bales higher this month, and at 89.6 million bales are 4.1 million higher than in 2021/22.
Source: USDA December 2023 WASDE report
The December WASDE said U.S. and global ending cotton inventories increased from the November report. The decline in global stocks was more a function of a 3.3 million bale decline in worldwide consumption than the 2.3 million bale stockpiled increase.
In 2023, the weather across the critical growing regions will be the crucial factor for the path of least resistance of cotton prices. However, as China emerges from its COVID-19 lockdowns, Chinese cotton demand could experience a significant increase, tightening cotton’s fundamental balance sheet.
BAL does an excellent job tracking cotton futures prices
The midpoint of the trading range in the cotton futures market since the March 2020 48.35 cents low stand at $1.03185 per pound. A 50% retracement of the move from the May 2022 $1.5802 high to the October 70.21 cents per pound low is $1.14115 per pound. At just above the 80 cents level on December 14, and seasonality that tends to take cotton prices higher in the spring when uncertainty over the annual crop peaks, cotton could be trading at a bargain level in late 2022.
The most direct route for a risk position in cotton is via the futures and futures options on the Intercontinental Exchange (ICE). The iPath Series B Cotton Subindex TR ETN (BAL) provides an alternative for market participants seeking exposure to the volatile cotton market without venturing into the futures arena.
At $57.92 per share on December 14, BAL had $12.743 million in assets under management. BAL trades an average of 4,204 shares daily and charges a 0.45% management fee. BAL is the only stock market product that tracks the cotton price.
The most recent rally in ICE March cotton futures took the price from 70.10 cents on October 31 to 89.92 cents per pound on November 16, a 28.3% rise.

Over the same period, BAL rallied from $48.58 to $62.35 per share or 28.3%, as the ETN did an excellent job tracking the nearby futures contract.
Inflation, China’s emergence from lockdowns, and the uncertainty of the 2023 worldwide cotton crop could push prices back to the $1 per pound level or higher during the first half of 2023. BAL is a product that will move higher and lower with cotton over the coming weeks and months.
More Softs News from Barchart
- Cotton Leaking Lower Overnight
- Turnaround Tuesday Results in Triple Digit Cotton Gains
- Cocoa Prices Climb on Dollar Weakness
- Sugar Rallies on Weaker Dollar and Higher Crude Oil Prices
On the date of publication, Andrew Hecht did not have (either directly or indirectly) positions in any of the securities mentioned in this article. All information and data in this article is solely for informational purposes.


/Space/Cargo%20spacecraft%20in%20low-Earth%20orbit%20by%20Paopano%20via%20Shutterstock.jpg)

