- Technical analysis is like everything else, people see what they want to see.
- In the case of corn, using simple trend techniques of reversal patterns and a loose interpretation of Elliott Wave Theory and Fibonacci Retracements, I see a long-term downtrend in the cash market.
- A similar argument could be made in soybeans, though here the situation is made a bit more interesting by the prospect of a record crop in Brazil in early 2023.
A question came in from a friend late Sunday, asking about technical analysis. Someone else had posted a series of daily price charts for March corn (ZCH23), January and March soybeans (ZSH23); all containing a number of pretty lines, notations, and mathematical equations. My friend tagged a number of analysts in his post, asking if anyone has an opinion on the technical targets laid out by the tech guy. Me being me, of course I have an opinion. As far as I can tell the tech guy had a target range for March corn between $7.40 and $7.80, January soybeans just shy of $16, with March up near $17. To quote another friend of mine, to say he’s a skeptic when it comes to technical analysis is an understatement, this is nothing more than “magic lines”.
By definition, technical analysis is the study of market action, primarily through the use of charts, for the purpose of forecasting price trends.[i] I’ve done a lot this over the decades, and usually with decent results. I’ve learned a few things along the way:
- Forecasting trends accurately is made more difficult due to Chaos Theory[ii].
- When it comes to choosing charts, we need to keep the Goldilocks Principle[iii] in mind.
- Though for long-term investment purposes, I do like to study monthly charts.
- I remind myself all the time to KISS: Keep It Simple Stupid
- And ultimately, Newsom’s Market Rule #6 comes into play: Fundamentals win in the end.
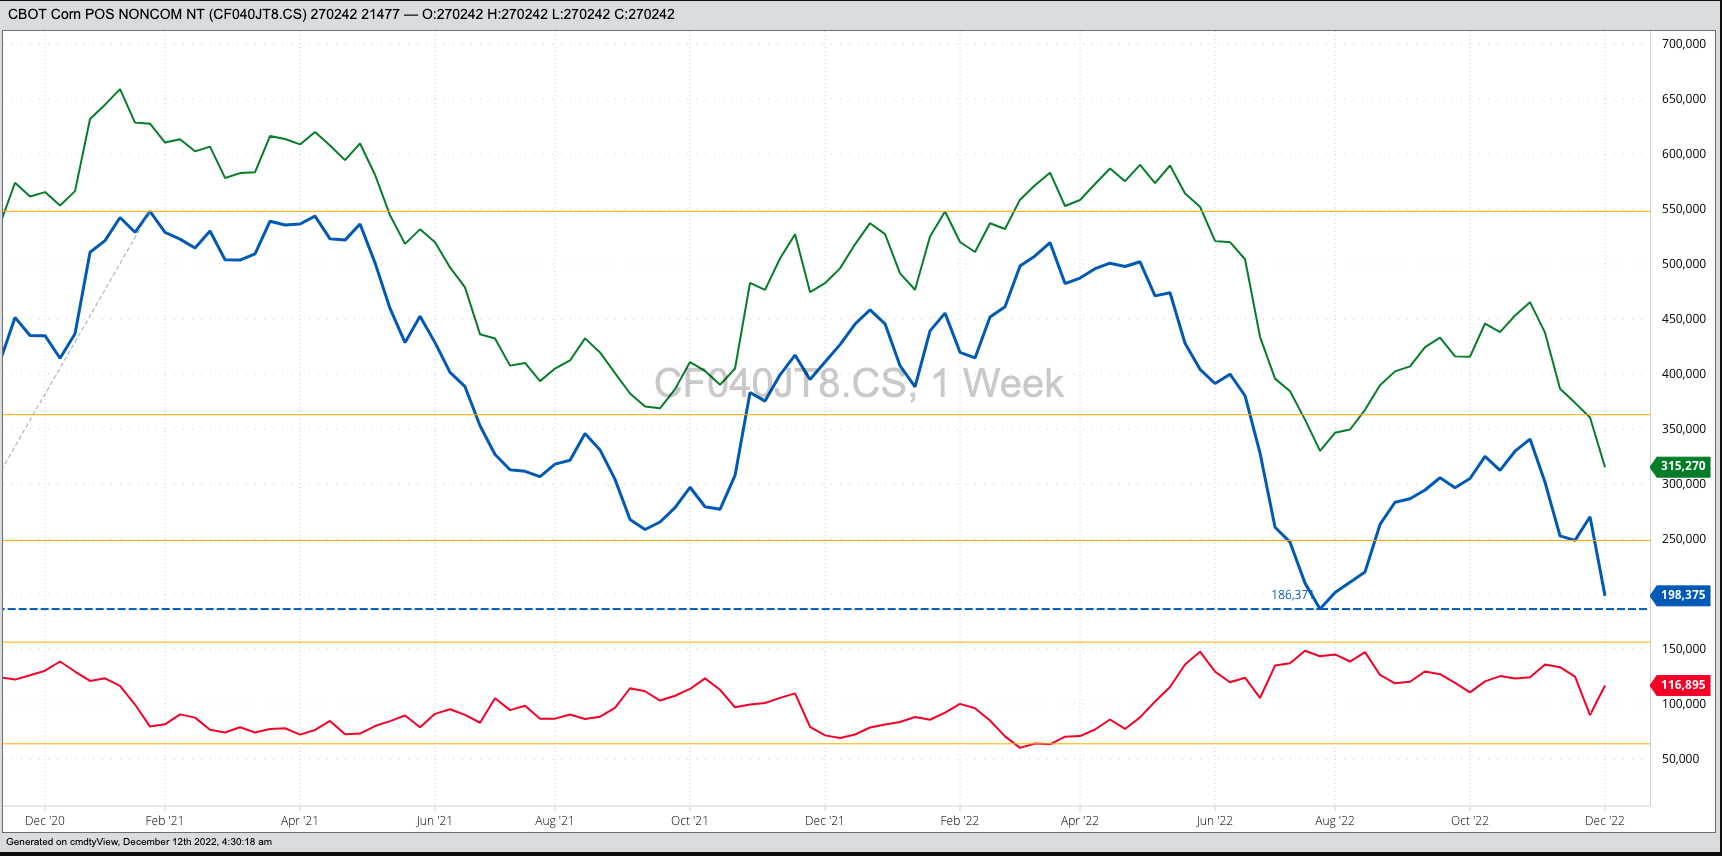
What do I see when I look at March corn’s daily chart? A contract that has moved into a short-term uptrend, but in reality probably isn’t going much of anywhere. Why? Because neither noncommercial nor commercial traders are interested in corn at this time. Let’s start with noncommercial traders, the group known to set the trend (price direction over time) of a market. The latest CFTC Commitments of Traders report (legacy, futures only) showed this group again reducing their net-long futures position (blue line on chart) by 71,867 contracts as of Tuesday, December 6. This included a reduction in long futures of 45,080 contracts (green line) and an increase in short futures of 26,787 contracts (red line). Additionally, it is hard to make the case for noncommercial traders to get interested in buying again given the commercial side has gone away until early 2023. Merchandisers sourced as many available supplies as possible to meet demand ahead of the threatened rail strike in early December. Given this structure, it would not be surprising to see corn’s characteristic Round Number Reliance play out, meaning solid resistance and support could be seen around every 10-cent move.
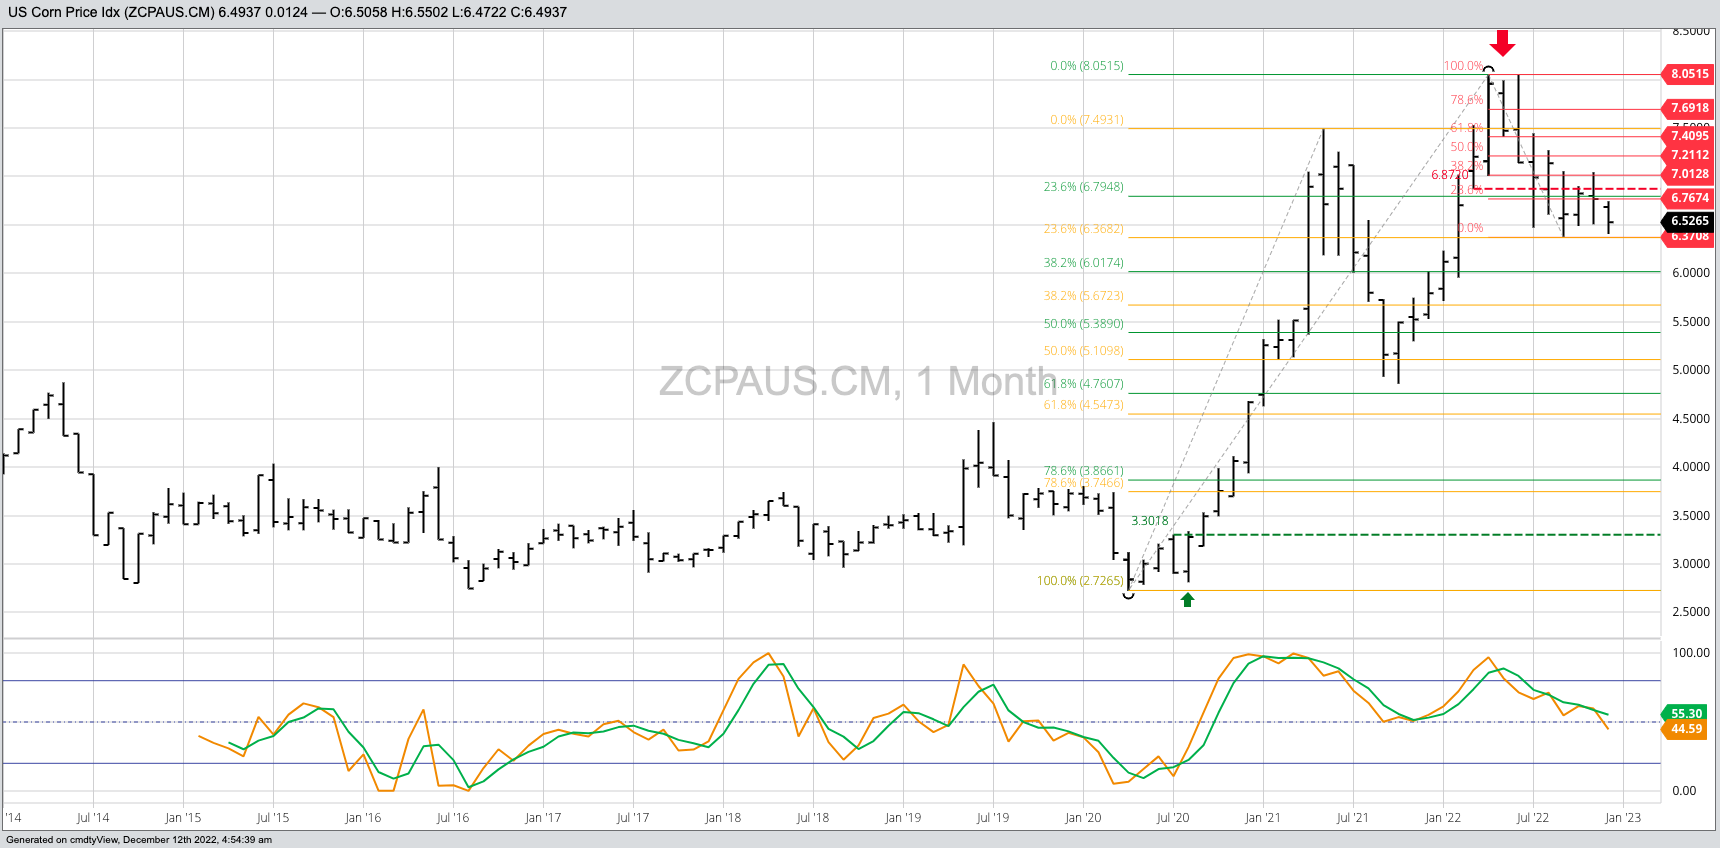
Lastly, the long-term trend of both the Barchart National Corn Price Index (ZCPAUS.CM) and corn futures turned down last spring, meaning a move to new highs seems unlikely. But again, that’s where chaos comes into play.
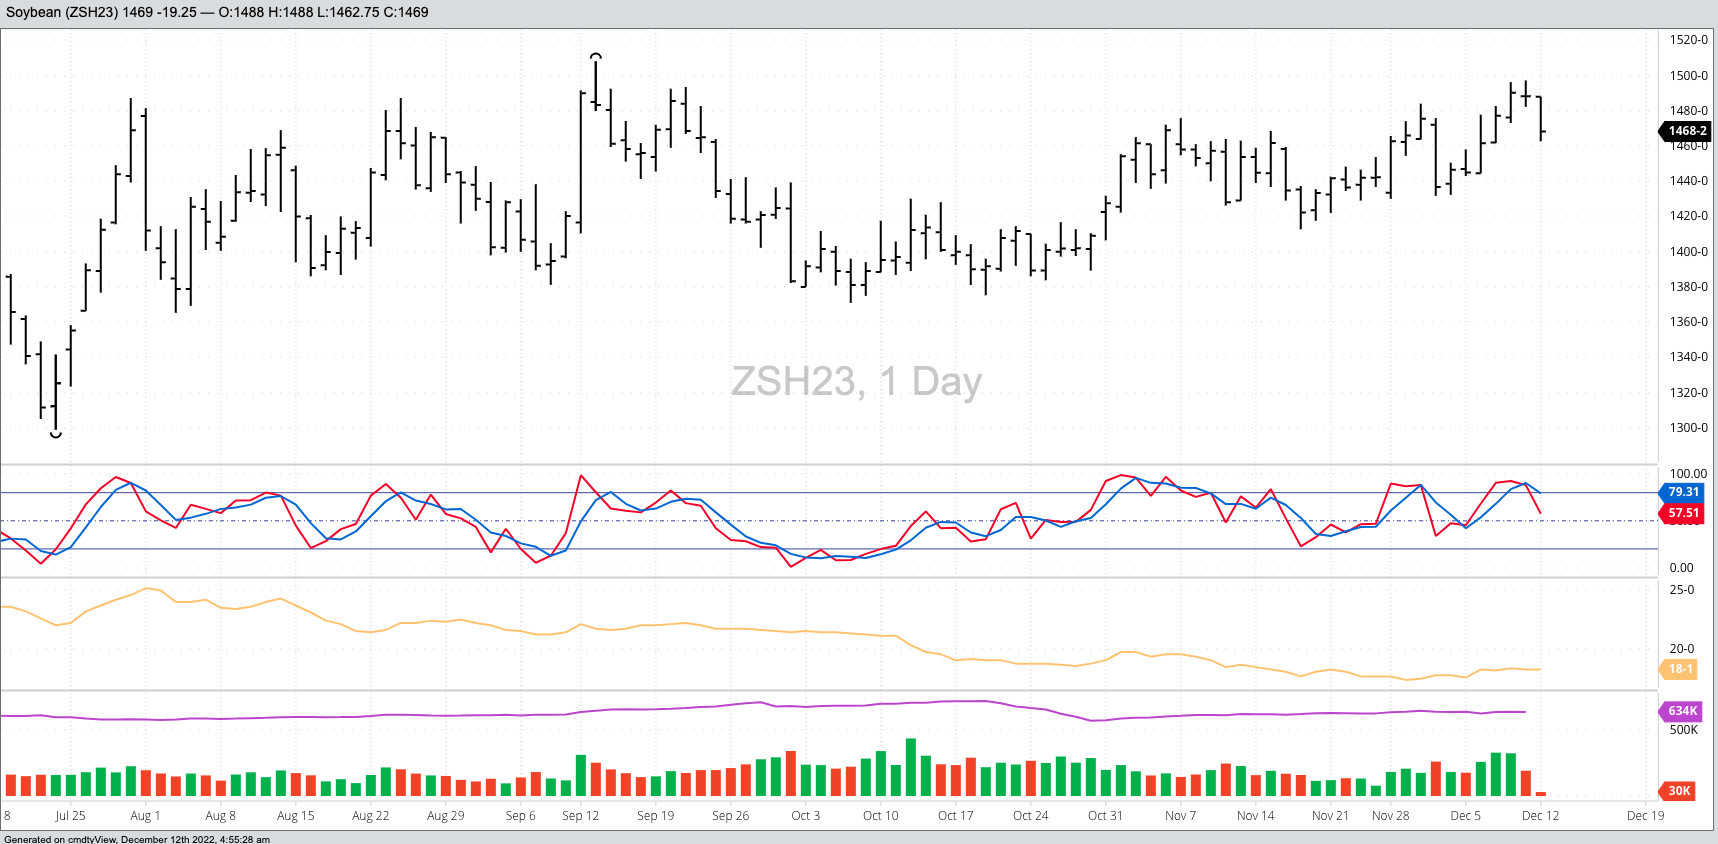
As for soybeans, the March contract is showing a roll to a short-term downtrend on its daily chart as of last Friday. The contract completed a bearish spike reversal in conjunction with a bearish crossover by daily stochastics above the overbought level of 80% (see, I can play the mumbo jumbo game as well). Meanwhile, the weekly chart shows a long, drawn-out consolidation pattern, usually seen in corn and somewhat unusual for soybeans. And similar to corn, the long-term monthly chart of the Barchart National Soybean Price Index (ZSPAUS.CM), the intrinsic value of the market, turned down this past June. So there’s that.
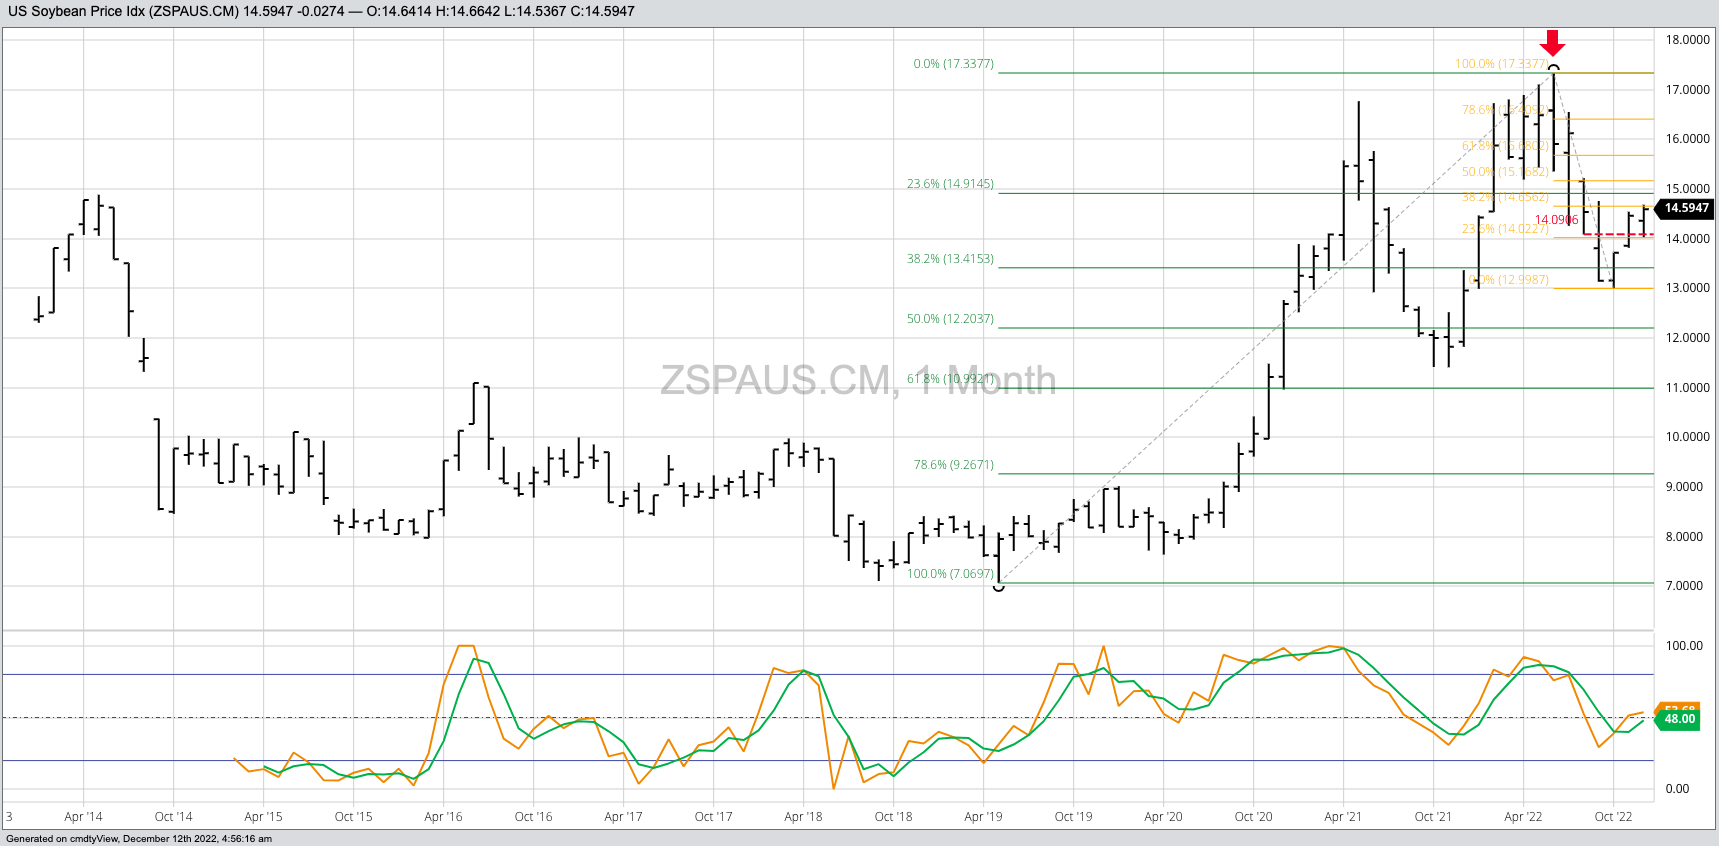
I’ll again bring up Newsom’s Market Rule #6 and remind folks what time of year it is. While North America is caught in the winter doldrums from late November through at least early January, it is summertime in South America. It is the equivalent of mid-June down in Brazil, and from what I’ve seen from pictures (yes, I know those can be misleading), China’s main supplier is looking at a robust, some would call it a record, soybean crop. This could make a rally to near $17 difficult for January or March soybean futures, unless the situation changes.
[i] From Technical Analysis of the Futures Markets by John J. Murphy, 1986 edition, page 1.
[ii] Chaos Theory tells us a small difference at a key time changes the result. Also associated with Black Swans and the Butterfly Effect.
[iii] The Goldilocks Principle reminds us daily charts are too hot, monthly charts are too cold, but weekly charts are just right.
More Grain News from Barchart
- Sunday Scaries: What I'm Watching This Week in the Grain Markets
- Wheat Ends Near Lows for the Day
- CoT Data Confirmed Liquidation in Soy Oil
- Mixed Friday in Corn Market
On the date of publication, Darin Newsom did not have (either directly or indirectly) positions in any of the securities mentioned in this article. All information and data in this article is solely for informational purposes.


/Super%20Micro%20Computer%20Inc%20HQ%20photo-by%20Tada%20Images%20via%20Shutterstock.jpg)
/Micron%20Technology%20Inc_logo%20and%20website-by%20Mojahid%20Mottakin%20via%20Shutterstock.jpg)