
A broken wing butterfly with puts is a butterfly spread with long put strikes that are not at the same distance from the short put strike.
A broken wing butterfly has more risk on one side of the spread than on the other.
You can also think of it as a butterfly with a “skipped strike”.
The trade is usually set up as a slightly bullish trade.
A broken wing butterfly with puts is usually created buying a put, selling two lower puts and buying one further out-of-the-money put.
An ideal setup of the trade is to create the broken wing butterfly for a net credit, in this way, there is no risk on the upside.
The main risk with the trade is a sharp move lower early in the trade.
Let’s look at an example using the iShares Russell 2000 ETF (IWM).
IWM Broken Wing Butterfly Example
On IWM, a January expiry broken wing butterfly could be set up through buying the 160 put, selling two of the 180 puts and buying the 190 put.
Here are the details of the trade as of yesterday’s close:
Buy 1 January 20, 160 put @ 9.40
Sell 2 January 20, 180 put @ 5.35
Buy 1 January 20, 190 put @ 1.55
Notice that the upper strike put is 10 points away from the middle put and the lower put is 20 points away.
This broken wing butterfly trade will result in a net debit of $25, which means there is very little risk on the upside.
The worst that can happen is all the puts expire worthless leaving the trader with a $25 loss.
On the downside, the maximum loss can be calculated by taking the width between the upper two strikes (10) multiplied by 100, plus the premium received.
That gives us 10 x 100 + 25 = $1,025.
The maximum gain can be calculated as 10 x 100 - 25 = $975.
The ideal scenario for the trade is that IWM stays flat initially and then slowly drifts lower to close around 180 at expiration. The main expiration profit zone is between 170 and 190.
The trade starts with delta of 4, so has a slight bullish bias to start, but that will flip to negative delta closer to expiry if IWM is still above 180.
In terms of risk management, I would set a stop loss of 10% of the capital at risk, or if IWM broke below 170.
This is what the trade looks like as of today:
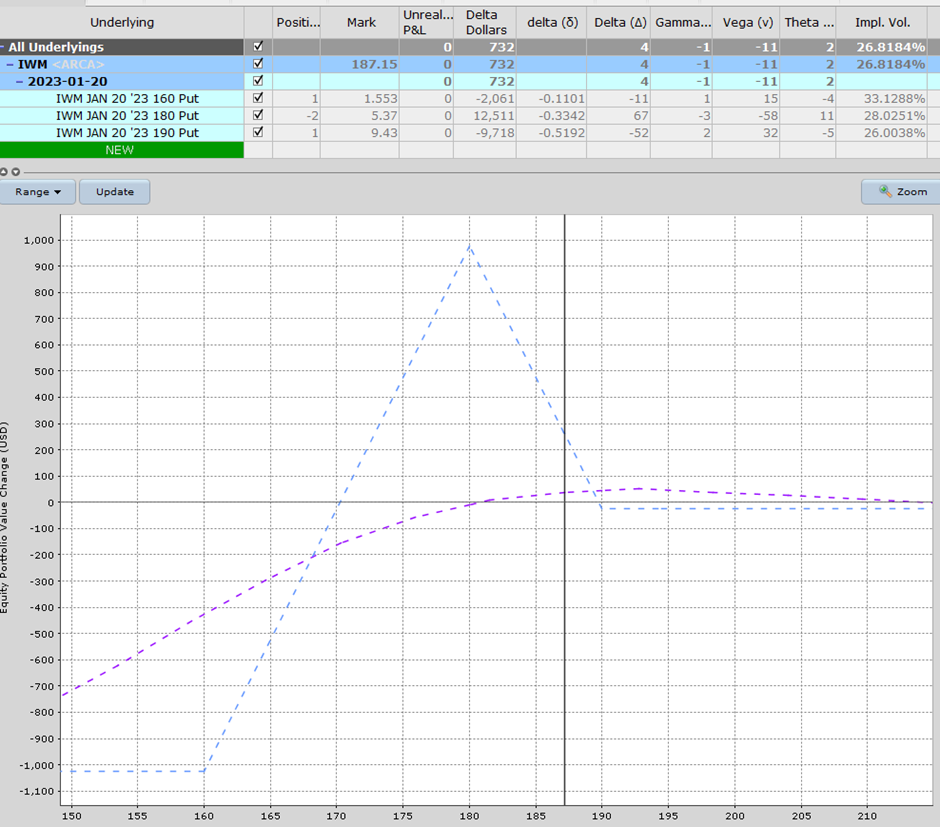
You can see the main risk in the trade is a drop in price early on. The blue line is the profit and loss at expiration and the purple line is the T+0 line. T+0 just means “today”.
So, we don’t want the stock to get into the profit tent too early.
What about in one month’s time? How does the trade look then?
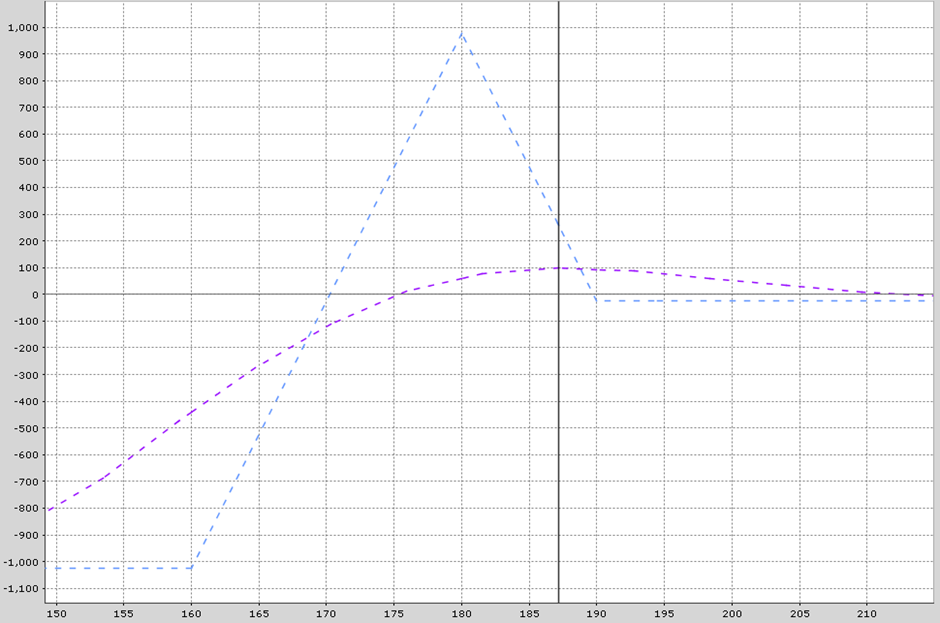
Looking a pretty good between say 175 and 205.
Summary
This strategy should move fairly slowly, unless there is a sharp drop in the stock price.
You can do this on other stocks as well, but remember to start small until you understand a bit more about how this all works.
Broken Wing Butterflies have a similar structure to put ratio spreads, but they have the extra protection from the lower put, making it a risk defined trade.
Mitigating Risk
With any option trade, it’s important to have a plan in place on how you will manage the trade if it moves against you.
A stop loss of 10% might make sense in this scenario. If IWM is below 180 near expiry, there will be assignment risk
If you have questions on this strategy, please let me know.
Please remember that options are risky, and investors can lose 100% of their investment.
This article is for education purposes only and not a trade recommendation. Remember to always do your own due diligence and consult your financial advisor before making any investment decisions.
More Stock Market News from Barchart
- Stocks Finish Higher as Inflation Concerns Ebb with Soft PPI Report
- Here's a Real Estate Play That's Got a Long Runway for Growth
- Optimism about Nvidia Improves but Risks Remain
- Stocks Rally as Slower Inflation Eases Fed Rate-Hike Concerns
/A%20close-up%20of%20a%20SpaceX%20sign%20by%20Sundry%20Photography%20via%20Adobe%20Stock.jpeg)


/A%20close-up%20of%20the%20SpaceX%20sign%20on%20a%20black%20building%20by%20IanDewarPhotography%20via%20Adobe%20Stock.jpeg)
/NVIDIA%20Corp%20video%20chip-by%20Antonio%20Bordunovi%20via%20iStock.jpg)