
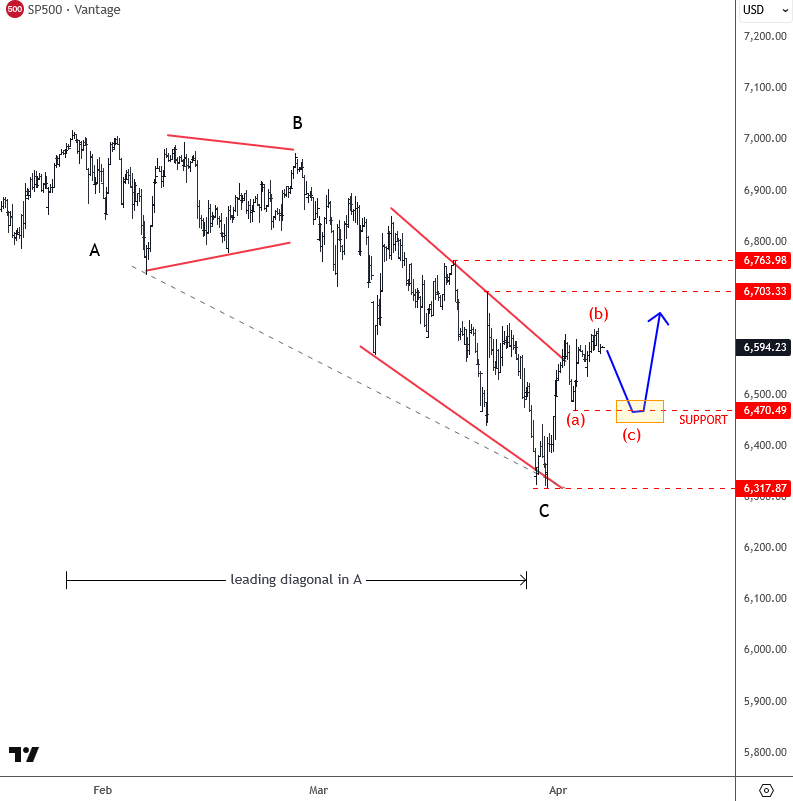
SP500 has made a very nice rebound from the March 30th low, and price is now recovering above the upper line of a potential diagonal formation as shown on 4h TF. This suggests that a temporary bottom may be in place and that the market could continue higher, at least in a three-wave recovery. And based on the latest price action, it looks like we are in an A-B-C structure, with a potential pullback offering short-term support around 6470. So as long as price holds above the 6317 swing low, there is room for more upside, possibly even a retest of the previous highs around 6700 to 6763.
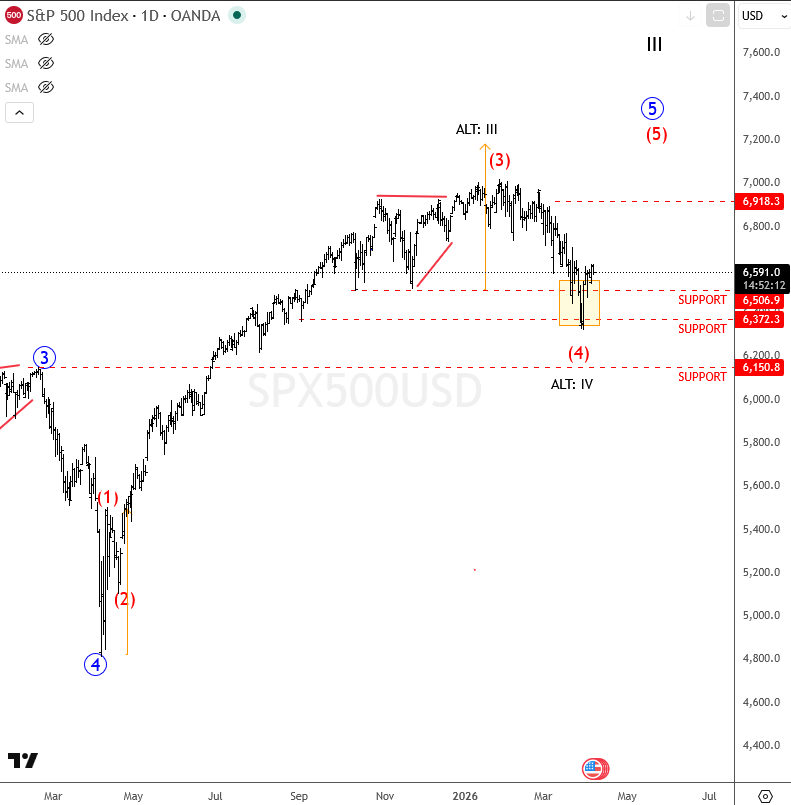
On the daily chart, the market reacted nicely from the 6500 support area, which may indicate that a higher degree wave four has been completed. If that’s the case, then wave five of five could still unfold later this year, likely in the second half.
However, if price starts to move lower once again, directly from here, then it would suggest that a larger wave IV correction is already underway, with next important support for this year, coming in around 5650 (check alt on weekly chart).


/NVIDIA%20Corp%20logo%20outside%20building-by%20BING-JHEN_HONG%20via%20iStock.jpg)
/Elon%20Musk%2C%20founder%2C%20CEO%2C%20and%20chief%20engineer%20of%20SpaceX%2C%20CEO%20of%20Tesla%20by%20Frederic%20Legrand%20-%20COMEO%20via%20Shutterstock.jpg)
/Super%20Micro%20Computer%20Inc%20logo%20on%20building-by%20Poetra_RH%20via%20Shutterstock.jpg)