
The Dow Jones Industrial Average in 2026 is being shaped first and foremost by the path of interest rates and broader monetary policy. After several years of aggressive tightening earlier in the decade, markets are now highly sensitive to any signal from the Federal Reserve about the timing and pace of rate cuts—or the possibility that rates stay higher for longer. Borrowing costs continue to influence everything from corporate investment to consumer spending, and for many of the Dow’s heavyweight constituents, margins are directly tied to financing conditions. Even subtle shifts in inflation data or labor market strength can ripple quickly through expectations, making the index feel less like a reflection of current earnings and more like a forward-looking bet on policy direction.
At the same time, global growth dynamics are quietly exerting just as much influence. The Dow’s multinational components depend heavily on overseas demand, and 2026 has brought a mixed backdrop: uneven recovery in parts of Europe, slower structural growth in China, and ongoing supply chain realignments that are still playing out years after their initial disruptions. Currency fluctuations, trade policies, and geopolitical tensions are no longer background noise—they are active drivers of earnings revisions and investor sentiment. When global demand shows signs of stabilizing, the Dow tends to respond quickly. Still, any renewed weakness abroad can weigh disproportionately on the index given its concentration in industrial, financial, and consumer-facing giants.
Technical Picture
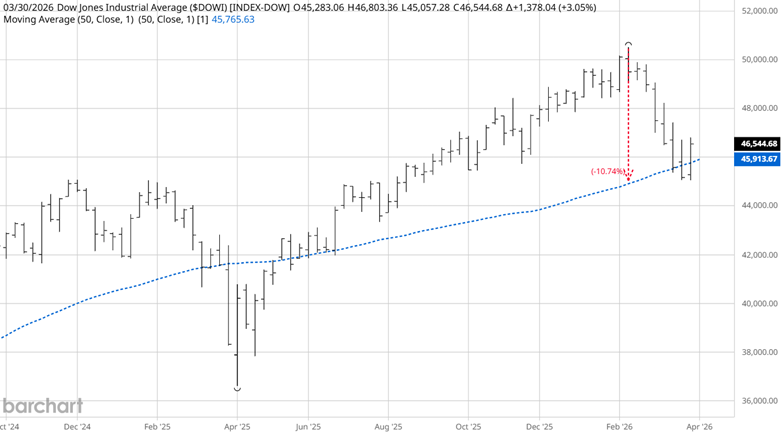
Source: Barchart
From a technical standpoint, the weekly chart of the Dow Jones Industrial Average shows a market that has recently undergone a healthy reset rather than a structural breakdown. After pulling back roughly 11% from its all-time highs, price retraced into the rising 50-week simple moving average, where buyers have begun to step back in, producing a constructive bounce and reinforcing that longer-term trend support remains intact—for now. The reaction at this level suggests institutions are still willing to defend the broader uptrend. Still, the next directional move may hinge less on pure technicals and more on external catalysts. In particular, the timing and resolution of the ongoing U.S. conflict with Iran could become a defining variable: a swift de-escalation would likely fuel risk-on momentum and confirm the support hold as a higher low, while a prolonged conflict could inject uncertainty, pressure sentiment, and potentially turn this bounce into a temporary pause before further downside.
Correlated Years
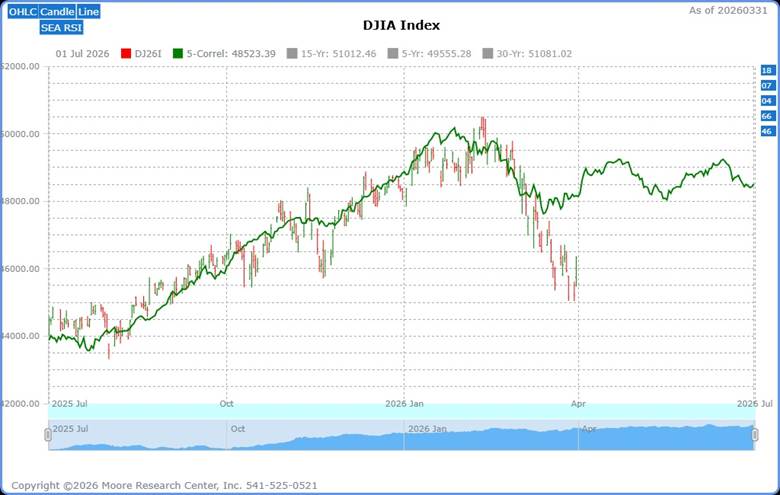
Source: Moore Research Center, Inc. (MRCI)
According to research from Moore Research Center, Inc. (MRCI), the current market environment closely aligns with a handful of historical precedents, each showing correlations of 84% or higher. Specifically, the years 1946 (85%), 1966 (91%), 2004 (89%), 2007 (88%), and 2018 (88%) all share striking similarities in their price structures and broader conditions. What stands out is that in each case, markets experienced a corrective phase followed by a recovery that pushed prices higher. The recent bounce we’re seeing, coming off a meaningful pullback, appears to be tracking the same pattern. While no historical analog is ever a perfect roadmap, the consistency across these five periods adds a layer of context that suggests the current rebound may have more room to run if the correlation holds.
Upcoming Optimal Seasonal Buy Window for the Dow Jones Industrial Average
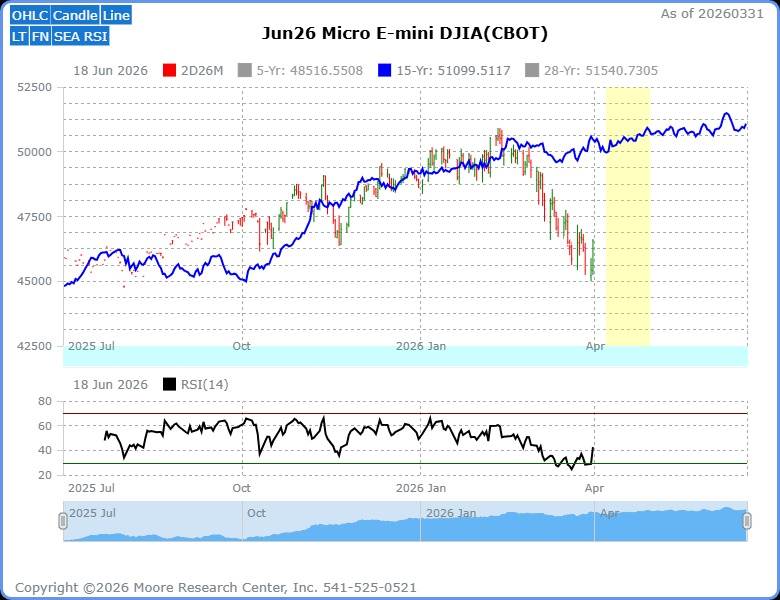
Source: MRCI
Looking ahead, the market is entering a historically bullish seasonal window (yellow box) based on a 15-year seasonal pattern (blue line), but the setup isn’t entirely straightforward. The short-term trend on the daily chart remains pointed lower, while the broader weekly trend remains intact to the upside, creating a bit of a tug-of-war in terms of direction. That kind of mixed environment typically calls for patience, and many traders may prefer to wait for additional confirmation that a durable bottom is in place before risking capital. That said, there are early signs of support forming—most notably at the weekly 50 SMA—where the RSI (14) has carved out a bullish divergence near the oversold 30 level, a pattern that often precedes an upward move. For traders with a higher risk tolerance, this could present an opportunity to start positioning in line with the seasonal tailwind as prices begin to lift. Still, with conditions currently supporting both bullish and bearish outcomes, this is the type of setup where having a clear, disciplined plan matters as much as the trade itself.
MRCI has recently announced they will be posting seasonal stock index patterns using the E-Micro indexes. This allows traders to participate with less capital and overall risk. The seasonal patterns remain the same ones we have come to respect; the only difference is that the highly correlated E-Micro indexes will serve as the trading vehicle.
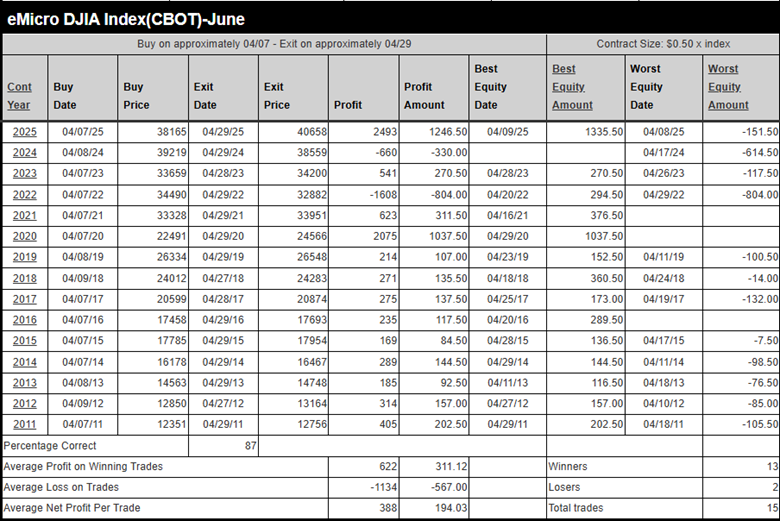
Source: MRCI
For this optimal seasonal buy window, MRCI research has revealed that the DJIA Index has closed higher on approximately April 29 than on April 07. The occurrence rate of this has been 87% over the past 13 of the past 15 years, and during the hypothetical testing of this optimal window, 3 of the years had no daily closing drawdown. The average net profit was 388 index points, or $194.03 per E-Micro DJIA Index futures contract.
As a crucial reminder, while seasonal patterns can provide valuable insights, they should not be the basis for trading decisions. Traders must consider various technical and fundamental indicators, risk management strategies, and market conditions to make informed, balanced trading decisions.
Assets to Trade the DJIA Index
Traders could trade futures using the E-Mini (YM) or E-Micro (YR) contracts. Equity market traders could trade the ETF (DIA). There are also options on the futures and ETFs.
In Closing…
In the end, this setup brings together a compelling mix of fundamentals, technical, and historical tendencies that traders look for when evaluating opportunity. On the macro side, shifting interest rate expectations and global growth trends remain powerful catalysts, suggesting any favorable developments could quickly translate into upside momentum. Technically, the market has already shown resilience by holding the rising 50-week average after a meaningful correction. At the same time, momentum signals, such as bullish daily RSI divergence, hint that downside pressure may be fading. Layer on top of that the strong historical correlations identified by MRCI and a well-defined seasonal window that has delivered consistent results over time, and you have a framework that supports a bullish bias—provided the setup continues to confirm. At the same time, the presence of mixed signals across timeframes and ongoing geopolitical uncertainty reinforces the importance of discipline. For traders willing to respect both the opportunity and the risk, this is the kind of environment where a well-structured plan can turn a probabilistic edge into a thoughtfully executed trade.
On the date of publication, Don Dawson did not have (either directly or indirectly) positions in any of the securities mentioned in this article. All information and data in this article is solely for informational purposes. For more information please view the Barchart Disclosure Policy here.


/An%20Intel%20sign%20out%20front%20of%20a%20corporate%20office%20by%20wolterke%20via%20Adobe%20Stock.jpeg)
/Alphabet%20(Google)%20Image%20by%20Markus%20Mainka%20via%20Shutterstock.jpg)
