
Like Tom Hanks’ character at the end of the movie Cast Away, the State Street SPDR S&P 500 ETF (SPY) is at a key fork in the road. Whether it takes the bullish or bearish path is critical.
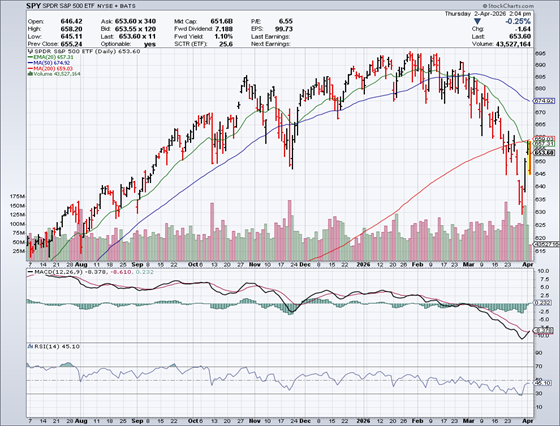
The stock market is closed for the Good Friday holiday, so it’s a good time to reflect on the bigger picture. My MoneyShow Chart of the Day shows SPY over a nine-month timeframe, along with a trio of exponential moving averages. I also included MACD and RSI indicators.
(To get more articles and podcasts from MoneyShow, subscribe to our Top Pros’ Top Picks newsletter here.)
Source: StockCharts
You can see the recent breakdown under the 200-day EMA on high volume. It was followed by a high-volume reversal in the $630s…and a test of the underside of the 200-day. The shorter-term 20-day EMA also broke through the 200-day, while the 50-day EMA has started to roll over.
Another thing worth noting: RSI was steadily declining for some time, even as price kept climbing through early 2026. That “fits” with the broader narrative in place BEFORE the Middle East war broke out – namely, that tech and AI stocks were losing steam, investors were rotating into new leaders, and volatility was on the rise in all kinds of places, including metals.
The bulls will argue this is like the Liberation Day selloff in 2025. If President Trump backs down and some kind of Iran deal gets worked out, we’ll be off to the races again.
The bears will counter that markets have been weakening behind the scenes for a while. Not to mention that last year’s tariff threats weren’t accompanied by $100+ oil and $4+ gasoline.
All I can say with certainty is that we’re at a critical market juncture. If SPY takes a “wrong” turn, it might be time to insure your portfolio against grimmer outcomes.

/Nvidia%20logo%20and%20sign%20on%20headquarters%20by%20Michael%20Vi%20via%20Shutterstock.jpg)

/Intel%20Corp_%20Santa%20Clara%20campus-by%20jejim%20via%20Shutterstock.jpg)
