Apollo Global Management, LLC’s APO fourth-quarter 2025 adjusted net income (ANI) per share of $2.47 surpassed the Zacks Consensus Estimate of $2.03. Further, the reported figure compared favorably with the year-ago adjusted net income of $2.22.
Shares of the company gained nearly 2.6% in the early trading session following the release of better-than-expected results. A full day’s trading session will depict a clearer picture.
Results were primarily aided by an increased assets under management (AUM) balance. However, rising expenses acted as a headwind in the quarter.
The results include certain items. After considering those, net income attributable to Apollo Global (GAAP basis) was $660 million, which declined from $1.46 billion in the prior-year quarter.
For 2025, ANI per share was $8.38, which surpassed the Zacks Consensus Estimate of $7.94. This compares favorably with $7.43 reported in the prior year. GAAP net income attributable to Apollo Global was $3.39 billion, which declined 24.2% year over year.
APO’s Quarterly Revenues & Expenses Rise
Total revenues were $1.2 billion, up 30.3% year over year. Also, it topped the Zacks Consensus Estimate by 4.4%.
Full-year revenues were $4.5 billion, which increased 22.3% year over year. The top line beat the Zacks Consensus Estimate of $4.4 billion.
Total expenses for combined segments rose 25.3% year over year to $218 million in the reported quarter.
Apollo Global’s AUM Balance Rises
Fee-earnings AUM increased 24.6% on a year-over-year basis to $709 billion. The rise was driven by strong management fee growth and record capital solutions fees. Asset Management contributed $104 billion in inflows, driven by fundraising across institutional and global wealth channels, as well as $21 billion related to the acquisition of Bridge Investment Holdings, while Retirement Services contributed $83 billion to gross inflows, driven by robust organic growth.
As of Dec. 31, 2025, total AUM was $938 billion, up 24.9% on a year-over-year basis. Total AUM benefited from $145 billion in inflows from Asset Management and $83 billion in gross inflows from Retirement Services, partially offset by $60 billion in outflows, driven by normal course activity at Athene and $22 billion from realization activity.
APO’s Capital & Liquidity Position Weak
As of Dec. 31, 2025, Apollo Global had cash and cash equivalents of $3.3 billion and debt of $5.5 billion.
Apollo Global’s Capital Distribution Update
The company announced a quarterly cash distribution of 51 cents per share with its earnings release. This dividend will be paid out on Feb. 27, 2026, to shareholders of record as of Feb. 19.
Our Viewpoint on APO
Apollo Global’s decent organic growth and increasing AUM balance look encouraging. The company’s fourth-quarter results reflect broad-based momentum across the platform. Its quarterly origination volume was robust, driven by a diverse array of investing activity across debt origination platforms, core credit, high-grade capital solutions and equity origination. The acquisition of Bridge Investment Group Holdings Inc. expands Apollo Global’s real estate expertise and strengthens its wealth business, supporting its financials.
Apollo Global Management Inc. Price, Consensus and EPS Surprise
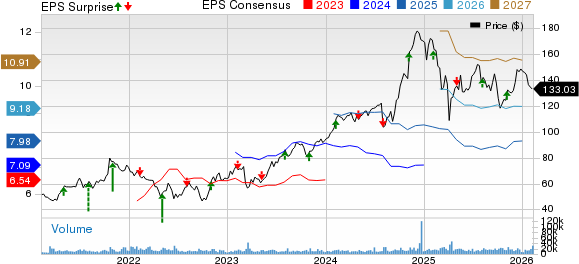
Apollo Global Management Inc. price-consensus-eps-surprise-chart | Apollo Global Management Inc. Quote
Currently, Apollo Global carries a Zacks Rank #4 (Sell).
You can see the complete list of today’s Zacks #1 Rank (Strong Buy) stocks here.
Performance of APO’s Peers
Invesco’s IVZ fourth-quarter 2025 adjusted earnings of 62 cents per share surpassed the Zacks Consensus Estimate of 57 cents. The bottom line increased 19.2% from the prior-year quarter.
IVZ’s results have been primarily aided by an increase in adjusted revenues. Moreover, growth in the assets under management balance to record levels supported the results to an extent. However, an increase in adjusted operating expenses was a headwind.
Franklin Resources Inc. BEN reported first-quarter fiscal 2026 (ended Dec. 31, 2025) adjusted earnings of 70 cents per share, which surpassed the Zacks Consensus Estimate of 55 cents per share. Also, the bottom line compared favorably with 59 cents reported in the year-ago quarter.
BEN’s results benefited from higher revenues and an improved assets under management balance. However, higher expenses remained a headwind.
Zacks Names #1 Semiconductor Stock
This under-the-radar company specializes in semiconductor products that titans like NVIDIA don't build. It's uniquely positioned to take advantage of the next growth stage of this market. And it's just beginning to enter the spotlight, which is exactly where you want to be.
With strong earnings growth and an expanding customer base, it's positioned to feed the rampant demand for Artificial Intelligence, Machine Learning, and Internet of Things. Global semiconductor manufacturing is projected to explode from $452 billion in 2021 to $971 billion by 2028.
See This Stock Now for Free >>Want the latest recommendations from Zacks Investment Research? Today, you can download 7 Best Stocks for the Next 30 Days. Click to get this free report
Franklin Resources, Inc. (BEN): Free Stock Analysis Report
Invesco Ltd. (IVZ): Free Stock Analysis Report
Apollo Global Management Inc. (APO): Free Stock Analysis Report
This article originally published on Zacks Investment Research (zacks.com).