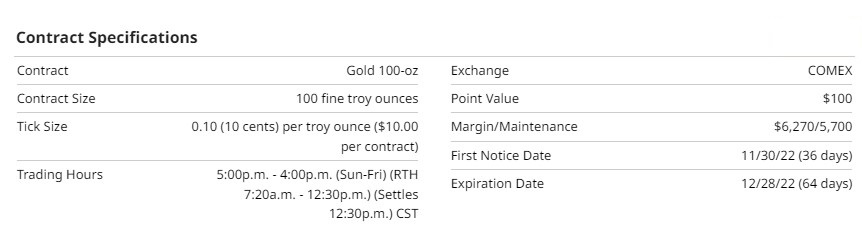
Specifications and Statistics
Gold has sentimental and emotional feelings attached to it. Before Eygpt made gold the first official medium of exchange for international trade around 1500 BC, other countries used it to make jewelry. Today, many collectors and investors feel gold is preferred over central bank currencies. In comparison, others claim that gold is an inflation hedge. Gold purchasing and gift giving are popular during the Chinese New Year, the Indian wedding season, and the Christmas holiday season. Plenty of other events impact gold demand and an attraction to the shiny metal.
In 1974 the COMEX exchange in New York traded the first gold futures contracts. Today, the COMEX is part of the Chicago Mercantile Exchange Group (CMEGroup) and still actively trades gold futures contracts.
The standard gold futures contract is very liquid to trade, with an average daily volume of 260K contracts, while the average open interest is 480K.
As of this writing, the front month December gold contract is trading at $1,660.0 per troy ounce. The contract’s notional value is $166,000. The required margin to trade a standard gold contract is $5,700 per contract, creating a leverage of 29:1. Traders should remember that leverage cuts both ways. The profits can be astonishing and wreak havoc on traders’ accounts with poor risk management.
Recent Performance
For the past 3-months, gold has been down 4.5%. The year-to-date has seen a 9.8% decline. Much of this selling pressure has been due to the Federal Reserve (Fed) aggressively raising interest rates, and historically, that is bearish for gold.
Fundamentals Impacting Market Behavior
Today, a large portion of gold is for jewelry. According to the World Gold Council, demand for jewelry was down 2% year-on-year during the first half of 2022. During the virus-related lockdowns in China, gold demand dropped but was countered by strong buying in India due to the wedding season and festivals.
The dollar and gold usually move inversely to each other. The Fed has aggressively pushed interest rates higher, leading to the US Dollar rallying to a two-decade high. Some Fed speakers commented that they feel the Fed needs to observe the economy for a while and see what impact this high rate cycle has caused. If the Fed finds evidence of a slowing economy, they may be content to stop raising rates for the short term.
Technicals Driving Futures Prices

The daily gold chart shows that the downtrend continues, and rallies are being met with sellers. A double-bottom reversal pattern is attempting to form. If gold can trade through the October 4th high of 1,738.7, the measured move target would be 1,855.0.
The downtrend started at $469 higher on March 03, 2022. Some would say gold is oversold, but picking bottoms is a risky way to trade. Traders should have a definitive way of defining the trend regardless if it’s a technical or price action approach. The 10 & 20 exponential moving averages (EMA) have only changed directions once during this current downtrend.

The continuous monthly nearby gold chart with the open interest indicator shows that open interest levels are at 8-year lows. The last time gold had open interest this low, the market drifted sideways and then had a significant rally. When the open interest began to increase, it was in December 2015. Notice how most Decembers after 2015 put in a low before a rally.
Seasonal Patterns

Moore Research Center, Inc (MRCI) has found that gold cash prices over the past 30 years have exhibited a powerful seasonal uptrend from mid-December to the latter of February. A portion of this demand comes from the Chinese New Year in February. The last monthly gold chart illustrates that this pattern does influence gold prices.
The Commitment of Traders (COT) Report

The above monthly gold chart has the open interest and legacy COT indicators. The green line is the large speculators, and the red line is the commercial traders.
Previously, the MRCI seasonal pattern showed that mid-December is approximately when the seasonal rally begins. Also, we noted that the open interest is at an 8-year low. When the open interest is low, a market tends to drift sideways to down for a while.
Declining open interest indicates traders are leaving the market. This is usually found after an extended up or down trend, and the large speculators and commercials are both exiting their positions. Usually, one would assume this is bullish. But, because we looked at the open interest and it is declining, we know that large speculators and commercials are exiting their positions, not building new ones. The COT chart above shows the large specs selling (green) and the commercials buying (red) recently.
I’m not pretending to have a crystal ball and predicting the future, but trading the current downtrend until the trend changes or we come to mid-December appears prudent. We will then be watching for the open interest to increase as the trend turns up if it does.
Related ETFs and Micro Futures Contracts to Participate
If the seasonal pattern is expected to last multiple months, consider using the exchange-traded fund (ETF) for gold (GLD). Both GLD and GC have options available to trade. The first choice would be trading the standard gold contract (GC), but if that is too expensive, consider the micro-gold contract (MGC).
Summary
Planning allows for better preparation for opportunities if they arise. Gold is in a well-defined downtrend and should be respected until it changes direction. During this time, you have a chance to decide which vehicle you will use to trade gold. Your trading plan should explain how to use a trailing stop to manage multiple contracts, allowing you to capitalize on a possible extended move. Continue monitoring the FED and listening for dovish interest rate talks among the members; this will also support the gold seasonal pattern.
The seasonal analysis allows for a systematic approach to setting up your trade instead of an impulsive one when prices begin to move quickly in December. Combining trend and COT report analysis helps to give a trader the needed edge in the market.
More Metals News from Barchart
- Dollar Falls Sharply on Lower T-Note Yields and Stronger Stocks
- Platinum in the Buy Zone- Leave Room to Add
- Stocks Rally on a Sharp Decline in Bond Yields
- Dollar Slightly Lower as Stocks Rally
/Oracle%20Corp_%20office%20logo-by%20Mesut%20Dogan%20via%20iStock.jpg)