
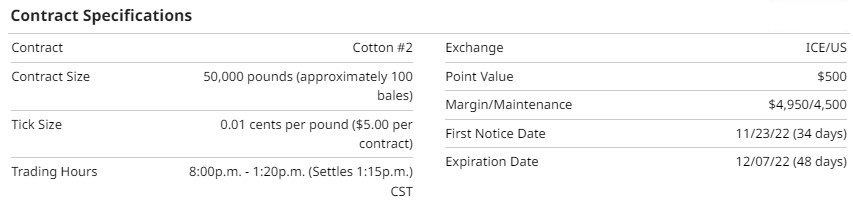
Specifications and Statistics
Cotton futures have been trading in the US since 1870 on the New York Cotton Exchange (NYCE). The NYCE was in the World Trade Center when a terrorist attack destroyed it in 2001. The NYCE was temporarily moved to Long Island City until it was acquired by the Inter-Continental Exchange (ICE).
India is the world's leading cotton producer, accounting for approximately 40% of the world's total, surpassing China recently. The US is third in rankings.
Cotton requires a long growing season, plenty of sunshine and water during the growing season, and then dry weather for harvesting. The Cotton Belt stretches from northern Florida to North Carolina and westward to California in the United States. In the US, planting time varies from the beginning of February in Southern Texas to the beginning of June in the northern sections of the Cotton Belt. Source: CRB Yearbook/Barchart
Cotton is the fifth leading cash crop in the US and is one of the nation's principal agricultural exports. The weight of cotton is measured in terms of a "bale," which equals 480 pounds. Source: CRB Yearbook/Barchart
Cotton continues to trade on the ICE exchange and averages 15K-25K contracts daily. The cumulative open interest averages 230K-250K contracts.
The front-month contract is December, and the cycle of contracts available to trade are March (H), May (K), July (N), October (V), and December (Z).
The December contract is trading at 77.50 US cents per pound, making the notional contract value $38,750. The required overnight margin is $4,500 per contract resulting in leverage of 8.6:1.
Recent Performance
During the past three months, cotton has declined by 17%. Its year-to-date performance is a similar decline of 16%.
The average daily range is 4.00 US cents per pound, creating a daily dollar price range of $2,000.
Fundamentals
In April 2021, the cotton market received a windfall of long speculative capital, creating a significant imbalance between supply and demand fundamentals. Due to the lower volume traded in cotton, prices became unpredictable and highly volatile. With the speculative money leaving the cotton market, we are experiencing a sharp decline in market prices.
Unlike grains, the cotton market is tied to discretionary products. During the stock market bull market, when the economy was booming, cotton was consumed more due to the expansive expendable income available. As the economy has begun to slow down in 2022, with a possible recession looming, cotton prices have fallen accordingly.
During the summer, the USDA forecasted cotton production could exceed the previous year by 4 million bales. In October, the USDA reported the slowing demand for cotton, creating fundamentally negative numbers.
Spreads
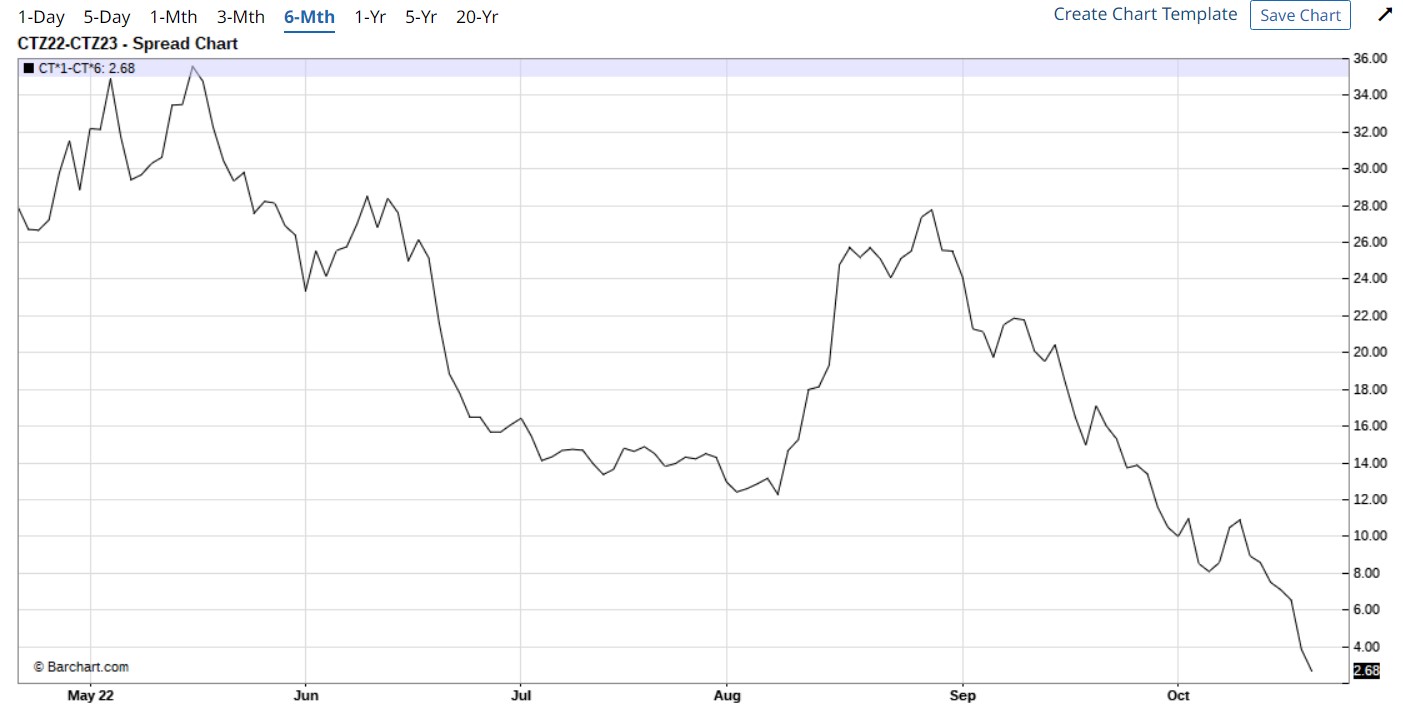
The year-over-year spread is very bearish for cotton. Closes back over the October highs would change the bearishness to more neutral.
Technicals
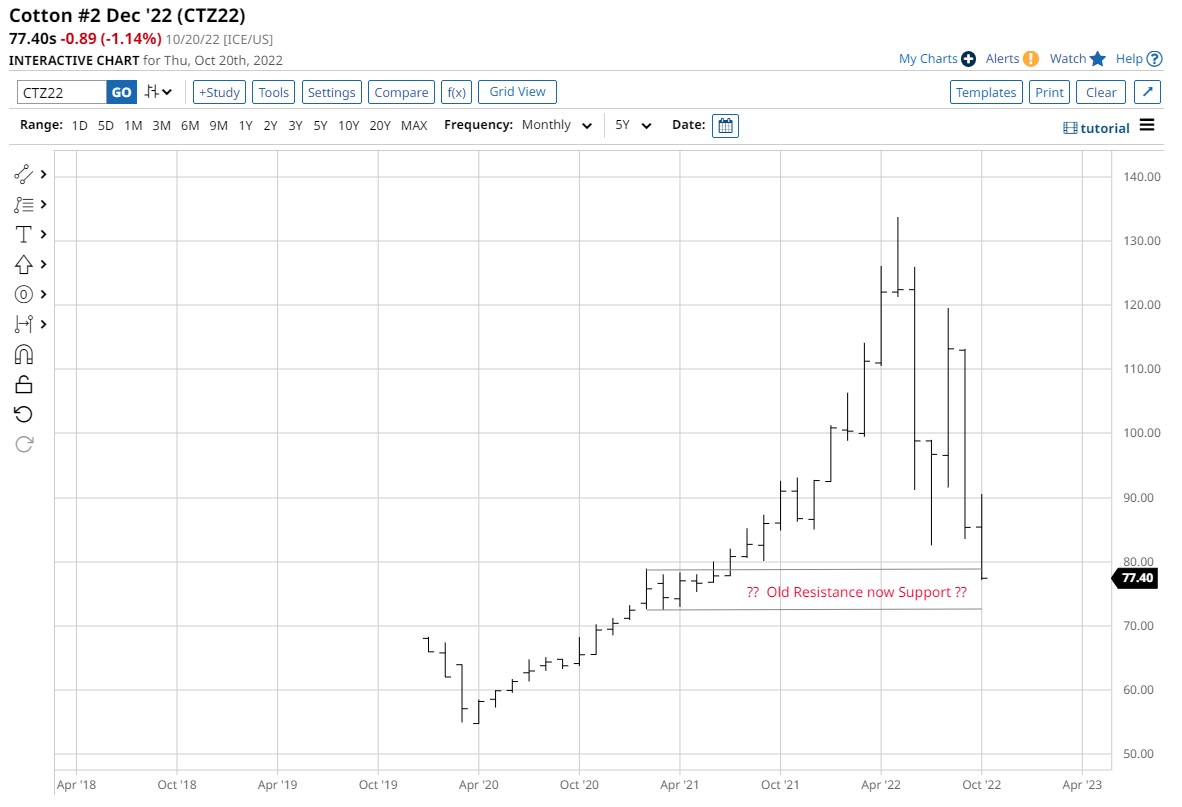
Technically the cotton market looks weak and not ready to be bought. One area of interest for a possible reversal is the monthly chart (above) area of consolidation and then a breakout from April 2021. Could this old resistance now become support when the price returns? We surely cannot tell the way that price is retracing.

The daily cotton chart above has two moving averages (10 & 20 EMA) and shows a strong downtrend. If the price enters the monthly chart support area and bases for some time, the moving averages could flip to an uptrend if prices turn up.
Seasonality
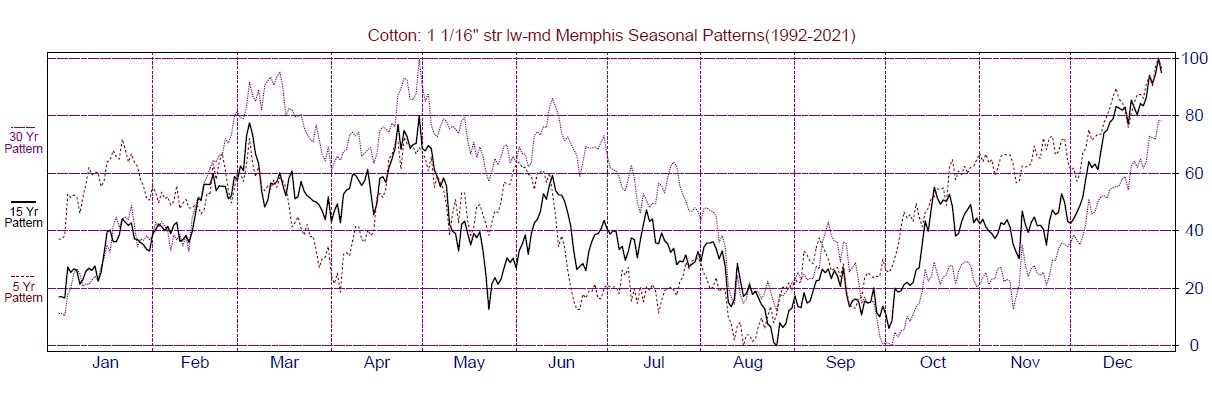
Source: Moore Research Center, Inc. (MRCI)
MRCI has found the seasonal low for the cotton market is in August. This seasonal pattern has me thinking we might have a price bounce soon. No seasonal pattern alone is a buy or sell— it's only what price has done historically.
Cotton tends to put a seasonal low in late August. This year the low was mid-July. As the market rallied from these lows, notice how the moving average up trend confirmed the low. The trend was stopped in August when the stock market signaled a slowing economy and dropped considerably, pulling down other related discretionary markets. Instead of holding above the prior seasonal low, cotton has fallen lower. Is the question, do the commercials want to keep buying cotton at these prices?
The Commitment of Traders (COT) Report
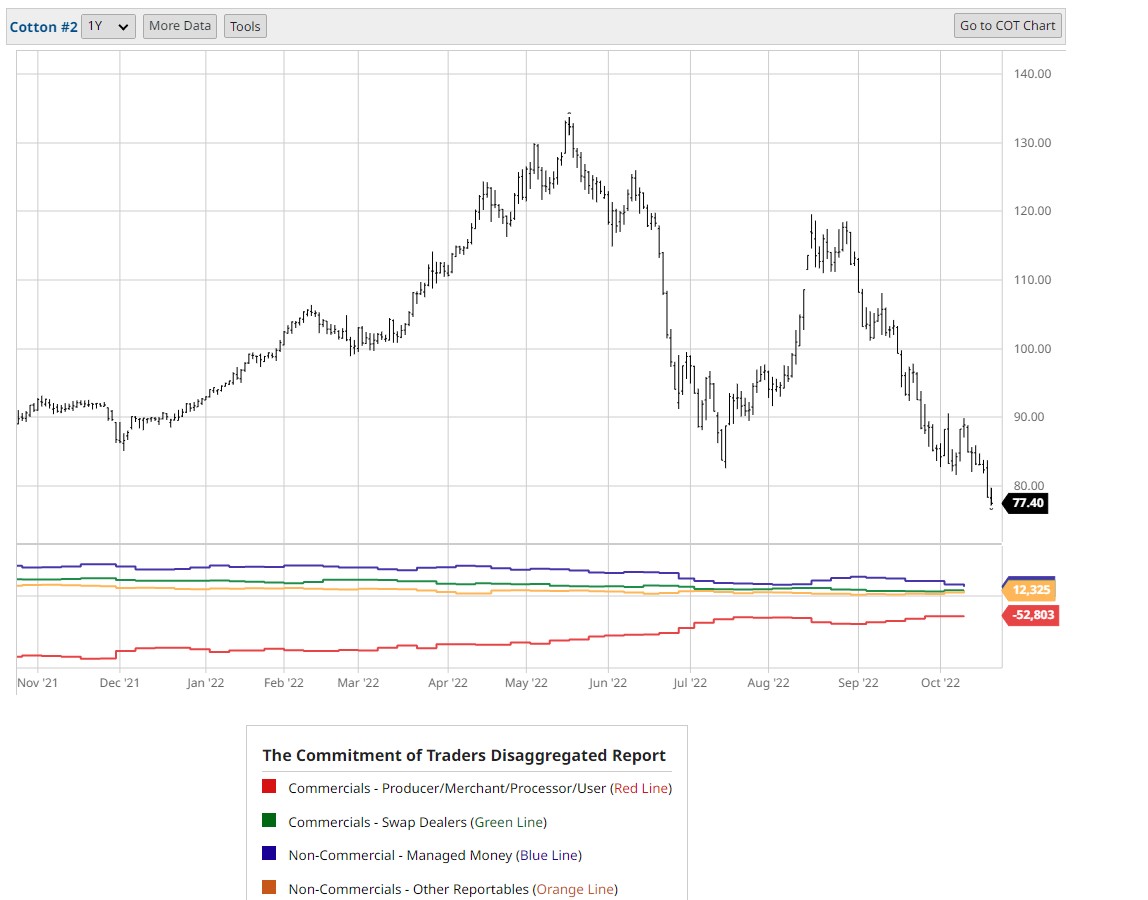
The COT report showed the commercials (red line) were the most bullish at the seasonal low in July than at any other time during the past year. At the same time, the managed money (blue line) was more bearish than at any other time in the past year. When cotton traded below the July seasonal low, the commercials began buying again, as indicated by the rising red line. Commercials typically scale into positions by buying as prices drop.
The monthly chart above shows support at this level, the commercials continued buying, and the second seasonal low from the MRCI chart might be enough to pause this downtrend long enough to get the trend to turn up.
Summary
This potential trade caught my eye, and I thought it might have a chance to play out. Trading involves screening markets for opportunities. Sometimes they are currently present, and others, you must put the trade on a watchlist and monitor its behavior. Usually, I would look for a setup where the trend, seasonal, and COT reports are already aligned.
For this trade to set up, I believe it will take the stock market rally to continue. The macro picture for the stock market is highly bearish at the moment.
An exchange-traded note (ETN) is available; the symbol BAL is indexed to one cotton futures contract. There are no micro or mini cotton futures contracts. As always, do your due diligence before investing your money.
On the date of publication, Don Dawson did not have (either directly or indirectly) positions in any of the securities mentioned in this article. All information and data in this article is solely for informational purposes.

/Space/Cargo%20spacecraft%20in%20low-Earth%20orbit%20by%20Paopano%20via%20Shutterstock.jpg)

