
The Financial Select Sector SPDR ETF (XLF) is currently giving off some very creepy vibes. These vibes are taking me right back to 2008.
XLF is, more so than many other sector exchange-traded funds (ETFs), the traditional engine of the U.S. economy. So when it is technically weak and showing little in the way of “vital signs,” I take note. I think it is a critical bellwether for broader market health as we approach the second quarter. And with interest rates still trending higher, the odds are stacked against it.
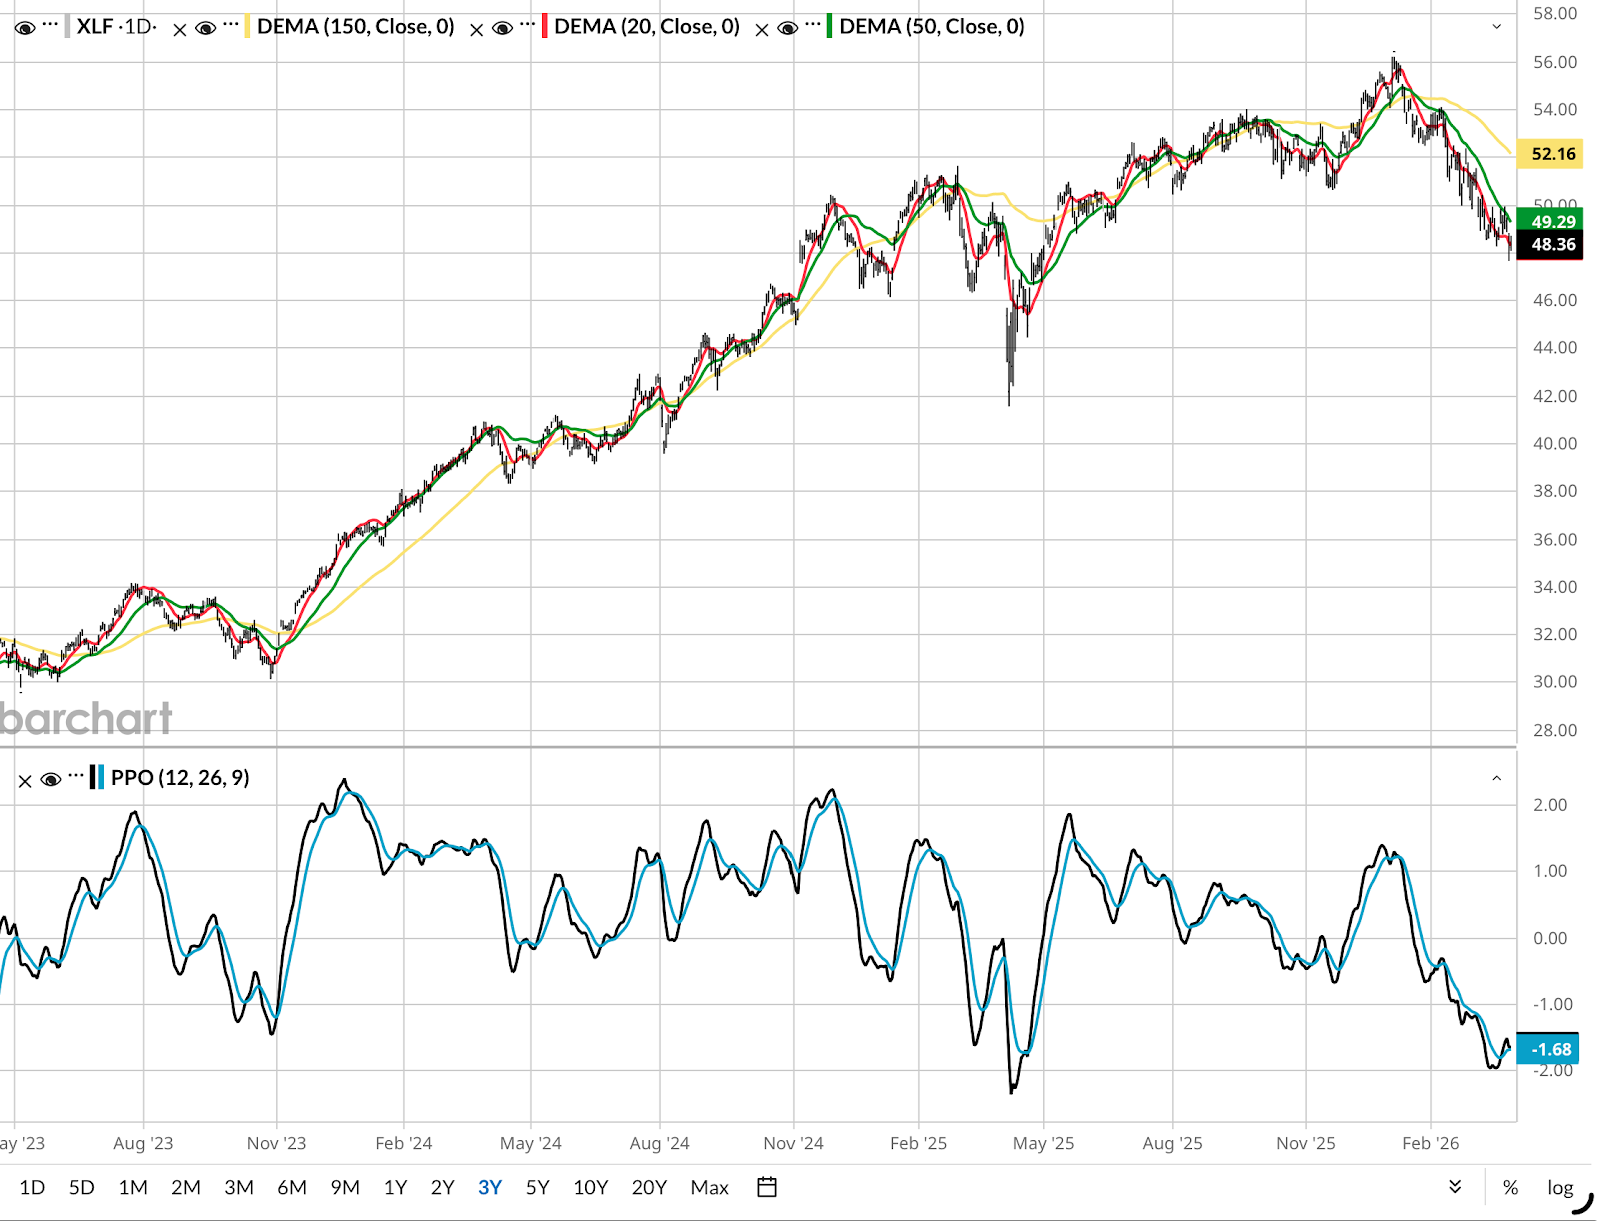
Here’s a daily chart of XLF. That’s a 20-day moving average that says very simply “buy the dip is NOT working!” I count 8 such dips that have failed already this year. And now the 150-day EMA in yellow has rolled over too. Translation: that’s a lot of selling pressure to reverse course. It tends not to happen in a flash.
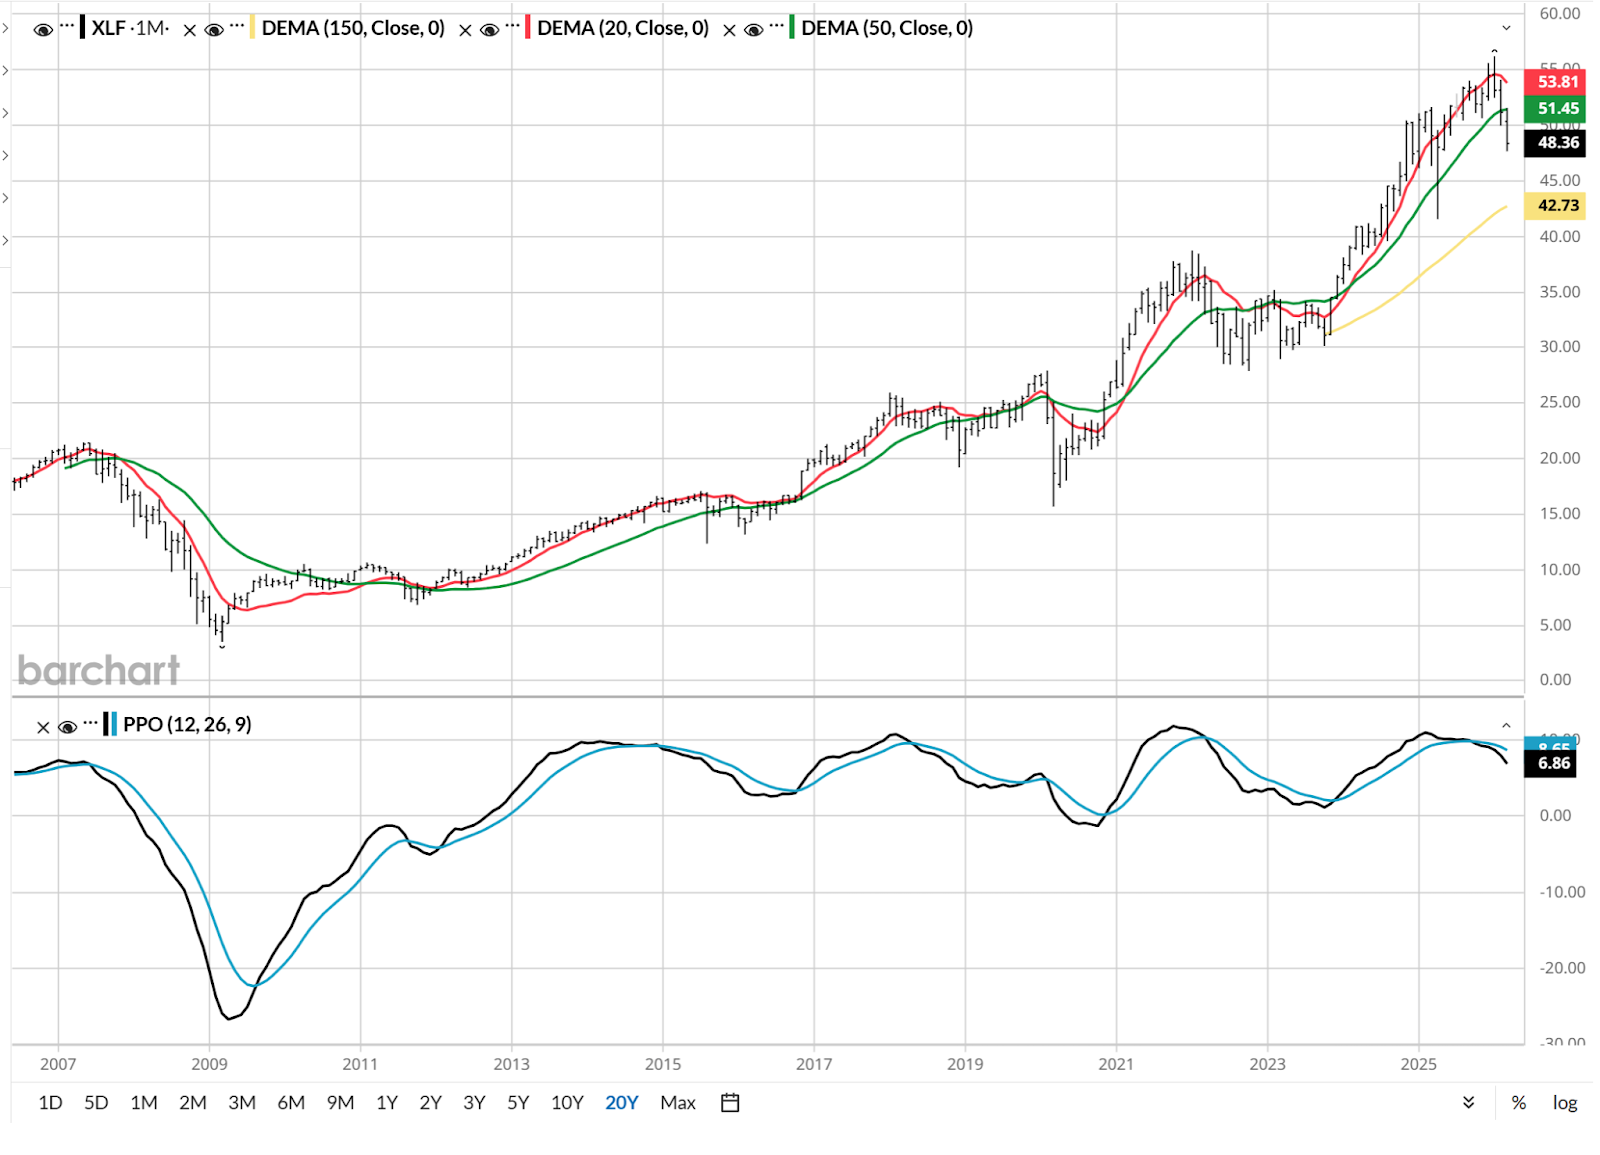
I’m skipping the weekly chart to go right to the monthly, for a very good reason. It allows me to show you that 2007-2008 period vividly.
Granted, this is a monthly view and thus changes trend slowly. But what I’m looking at is the 20-month EMA (red line) and how close it is getting to crossing through and below the green line (50-month EMA). That’s a serious shift in long-term momentum. And it is perhaps just a few months away from happening, in a picture similar to the Global Financial Crisis in 2008.
And while there have been “false alarms” in this ETF’s chart history, that simply meant more of a quick decline that didn’t stick for long. Such as 2011, 2020, and 2022. Of note: each of those periods was saved by Federal Reserve intervention. This time around, that’s going to be harder to do, given broader economic conditions, particularly inflation.
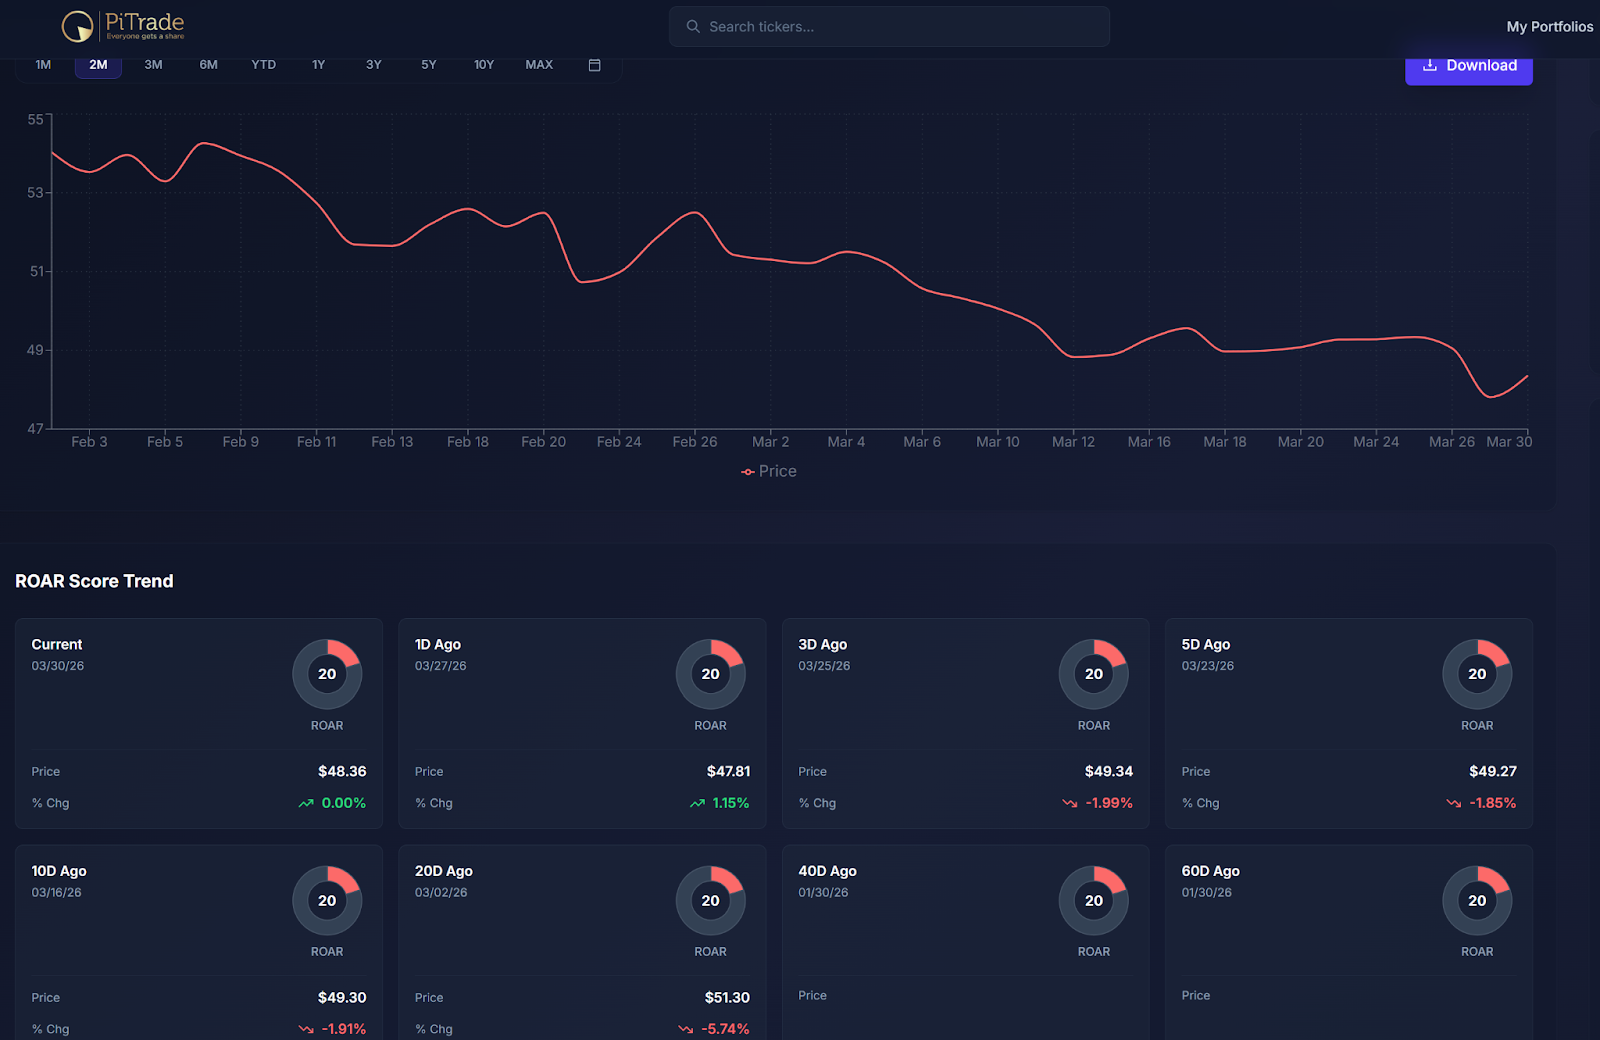
The ROAR Score for XLF has been “dead red” since the ETF traded in the $54 range, versus its $48 close on Monday. And with the score at 20 currently, it will take more than a bounce to turn that tide.
The Bull Case for Financial Stocks
The bullish narrative for XLF rests on the normalization of the yield curve and a potential rebound in capital markets. After a long period of inversion (short-term yields higher than long-term yields), the spread between the 2-year and 10-year U.S. Treasury yields has moved back into positive territory.
This steepening of the curve is fundamentally positive for banks as it allows them to borrow at lower short term rates and lend at higher long term rates, thereby expanding their net interest margins. Optimists also point to the high expected earnings growth for many underlying holdings such as JPMorgan (JPM) and Goldman Sachs (GS). They both report early in earnings season.
On the bearish side, the narrative is dominated by the looming credit risks within the commercial real estate sector. There is significant concern surrounding the debt wall as nearly $1.5 trillion in commercial loans are set to mature throughout 2026.
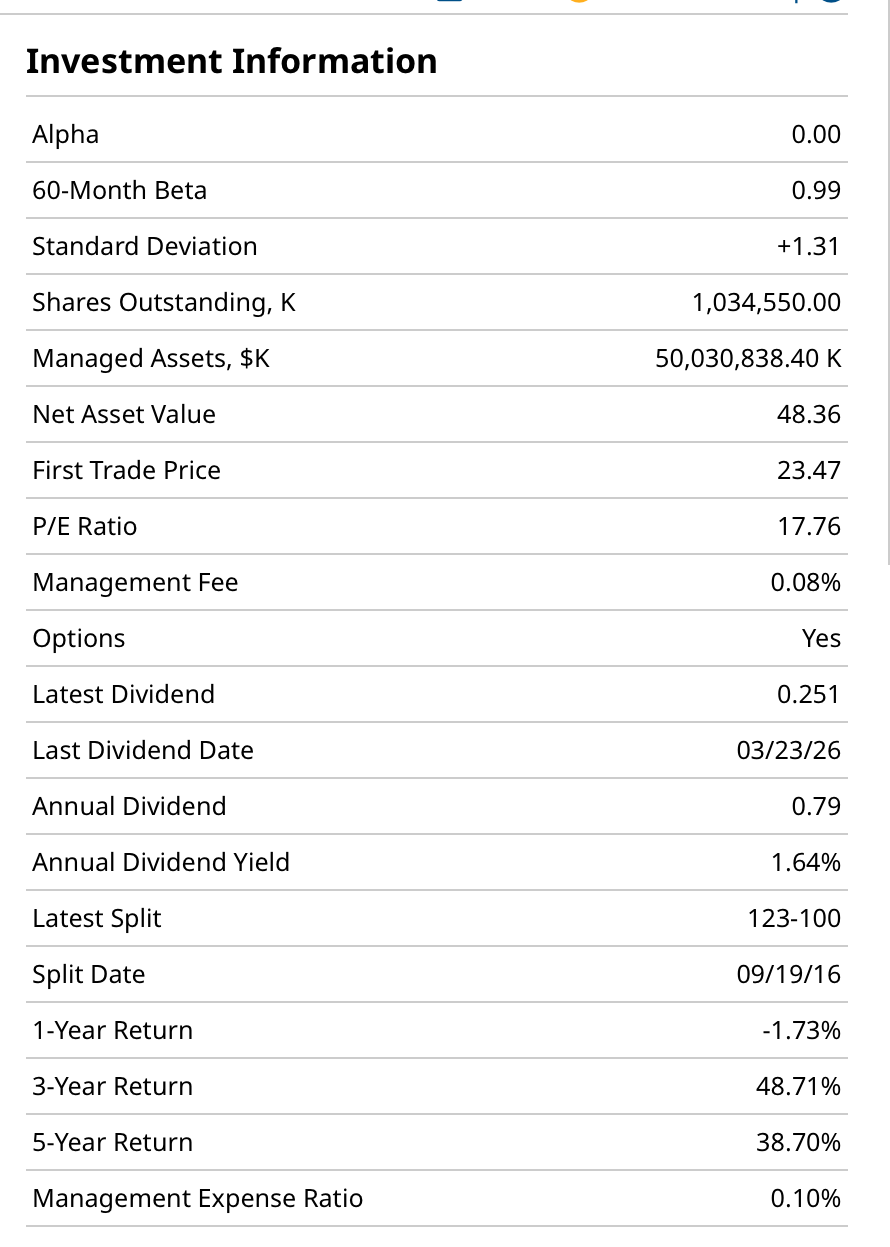
A trailing price-earnings ratio under 18x, as shown above, might be seen by some as “cheap.” But not when we examine the surroundings. I can’t be optimistic here. And this sector is too vital to the broader market, as it is the biggest single component of value indexes.
Ultimately the decision to engage with XLF in the current environment depends on one’s outlook for the credit cycle versus the interest rate cycle. But I’ve seen this movie before. And increasingly, it reminds me of the “Big Short.”
Rob Isbitts created the ROAR Score, based on his 40+ years of technical analysis experience. ROAR helps DIY investors manage risk and create their own portfolios. For Rob's written research, check out ETFYourself.com.
On the date of publication, Rob Isbitts did not have (either directly or indirectly) positions in any of the securities mentioned in this article. All information and data in this article is solely for informational purposes. For more information please view the Barchart Disclosure Policy here.
/Microsoft%20headquarters%20By%20Peter.jpeg)
/Micron%20Technology%20Inc_%20logo%20on%20building-by%20vzphotos%20vis%20iStock.jpg)
/NVIDIA%20Corp%20logo%20outside%20building-by%20BING-JHEN_HONG%20via%20iStock.jpg)
/Amazon%20-%20Image%20by%20bluestork%20via%20Shutterstock.jpg)
/Robot%20arm%20industrial%20automation%20manufacturing%20by%20Eakrin%20via%20Adobe%20Stock.jpeg)